Slow Decoupling Underway
One of our favourite topics and trades in the past has been mean reversion between Canada and the U.S. economies, and cross-currency trades between the two countries. Although linkages will always exist, some strong past correlations might evaporate due to a slow unwind of the close economic ties that have defined the past 30-40 years in North America.
We once wrote a 30-page overview of Canada, its politics and markets, that has been used to introduce potential international clients to the unique characteristics of Canadian geography, politics, equity and fixed income markets since 2019. In that piece, we wrote in summary that "although it remains closely tied to the U.S […], the Canadian economy is unique from our southern neighbour," with a slight amount of trepidation since there has always been1 a great deal of correlation between the two economies, especially since the original Free Trade Agreement2 was signed in 1988. However, we now believe, as do many others, that a long-term decoupling is underway which will change the nature of Canadian cross-currency trades, potentially forever.
High Correlation
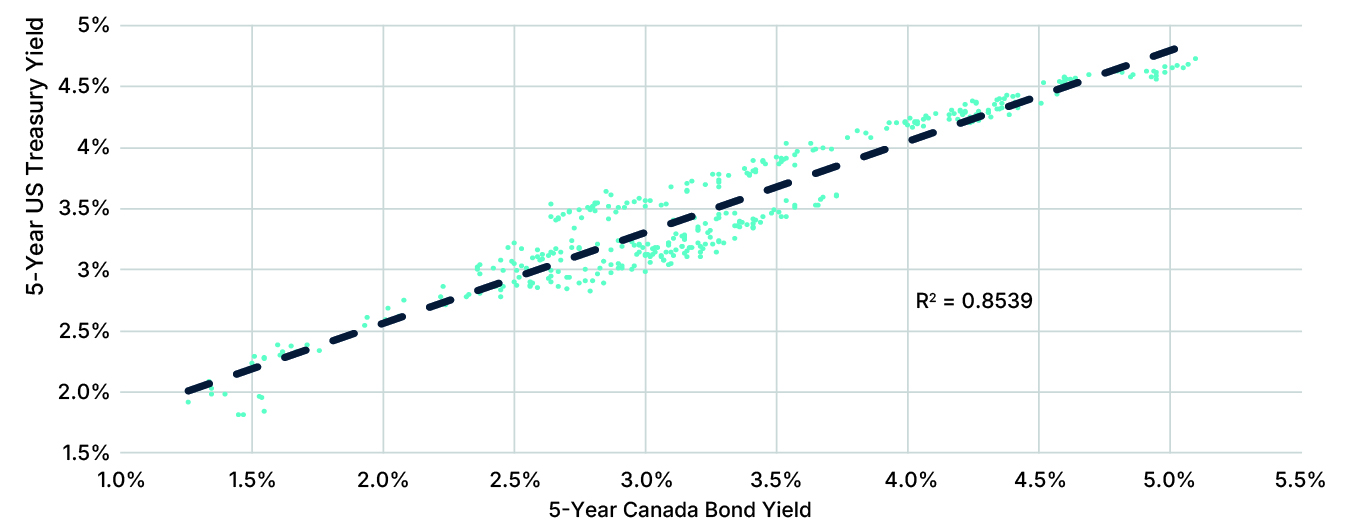
We can establish a reference point by examining the 5-year yield levels of the two nations' economies during the financial crisis. During this crisis, the main issue began as a preponderance of aggressive mortgage lending to barely (if at all) qualified borrowers, which led to a loss of trust in banks, not only in the classic sense of a depositor bank run but in interbank lending and dealing. While Canada could never be expected to be immune from this crisis, Canadian lending practices were always much more conservative, and the banking system remained largely strong3. However, during this made-in-America crisis, as shown in Figure 1, where we regress the Canada 5-year yield versus the U.S. 5-year treasury yield, the two bond markets had an R-squared of 0.91 or a correlation of over 95% (R coefficient). By standard interpretation, this analysis leaves just 9% of the Canada yield to be explained by non-exogenous factors such as better bank governance, more conservative lending practices, and less elevated home prices.
Figure 1
Canada - U.S. 5-Year Regression, July 2007 - December 2008
Source: BMO Capital Marketsi Fixed Income Sapphire database
While not all periods exhibit such a high correlation, we found that over the 18 years leading up to the 2024 U.S. presidential election, the long-term r-squared between the two 5-year yields was 0.85. This correlation is illustrated in Figure 2, which shows a value not significantly below the Great Financial Crisis period depicted in Figure 1.
Figure 2
Canada - U.S. 5-Year Regression, 2006 - November 2024
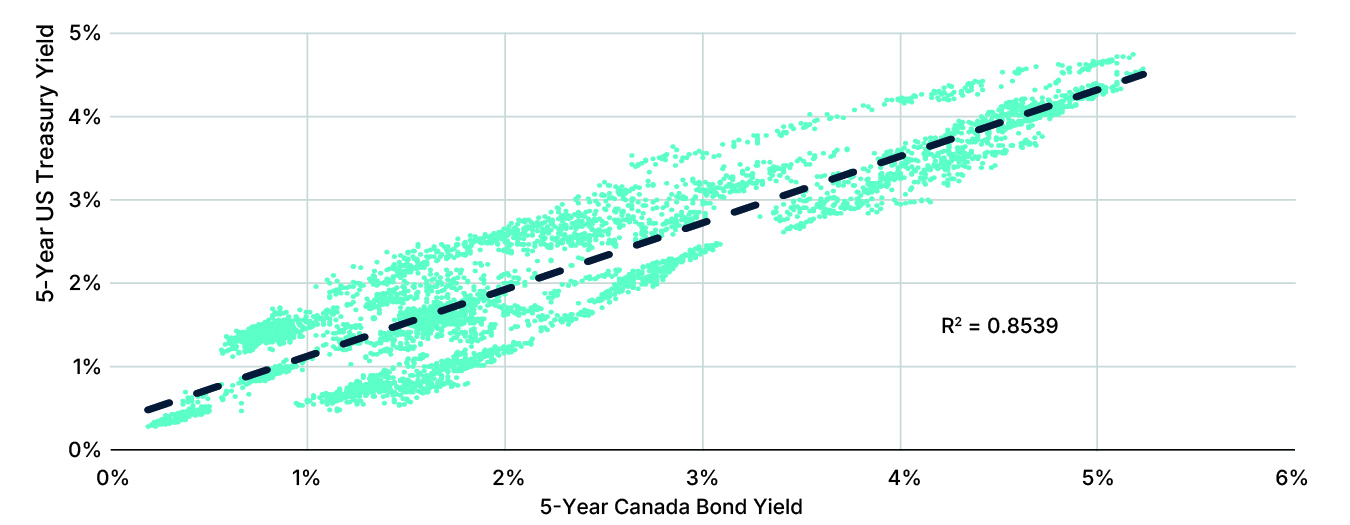
Source: BMO Capital Marketsi Fixed Income Sapphire database
Reliable Mean Reversion
Of course, there was very good cause for the U.S. and Canadian economies to be highly correlated given the preponderance of trade between the two nations. In fact, when we speak of the correlation between the two bond markets, we are essentially speaking of Canada's correlation to the U.S. market, much as in the figures above where the U.S. bond yield is the endogenous factor. Divergences between the economies and especially the bond markets4 were opportunities for risk takers to place mean reversion style trades that would profit when a divergence between, for example, the 10-year yield in the U.S. and the same yield in Canada closed or narrowed.
A Key Difference
Most market participants consider the phrase "it's different this time" an opportunity to be suspicious of the speaker. Still, we believe the fundamentals underlying the correlation between the U.S. and Canada will change significantly, although slowly. The current swing away from Canada's dependence on U.S. markets appears, at least today, just around a month into the "Tariff War," much more deeply rooted than many expected. We will not cite individual commentators as no one knows whether Canadians can take the more difficult road of diversifying the economy. After all, our dependence on the U.S. came about because that was, almost always, the path of least resistance. A giant market of wealthy customers that are geographically close to us was an easy choice to make.
Our primary reason for suggesting that recent policies and Canadians' reaction to them will not fade away is that about half of American voters approve of the move to impose tariffs on virtually all trading partners5. This large group still believes, in the second week of April, after about a week of market turmoil and media/market disbelief of the policy, that the president is doing a good job and supports his tariff policy. Like the Brexit vote in the United Kingdom last decade, this large group of voters has consciously or unconsciously chosen to reduce their living standards by eliminating the Ricardian gains from trade.
From the ongoing support of the president, we conclude that, even if Donald Trump was not president, the groundswell of support for the movement that he started will remain and policy will not be fundamentally different anytime soon, possibly even if there were a change of governing party in 2026 and 2028. Further, trust is gained over time but lost very quickly in international trade, as in any relationship. Many Canadian businesses will be slow to trust again, and a movement towards diversifying the economy away from U.S. exports should be sustainable, over the next generation or more.
Change Will Be Slow
When the Canada-U.S. Free Trade Agreement (CUSFTA) was signed in 1988, Canada's exports to the USA were 8.5% of GDP, and 35 years later, they had risen to 11.6% in 2022 but had been as high as 13.5% in the 2011 to 2015 era6. The U.S. has recently been the destination for about 76% of total Canadian exports7. Naturally, these numbers are slow to change for large economies and will likely never drop to a point where the U.S. is not Canada's largest trading partner.
As evidenced by the pre-CUSFTA value, Canada's history has shown considerably less dependence on U.S. markets. Based on current trends, as Canadian firms develop relationships with new buyers, particularly oil and natural gas, we project that the percentage of Canadian exports destined for the U.S. will fall over the next 10 years. This decline could reach less than 50%, if a concerted effort is made8. Consequently, the percentage of GDP that exports to the U.S. represent will likely fall well below the 1988 level.
Implication for Fixed Income Markets and Participants
A slow migration from dependence on American markets towards a more diversified customer base for exports would have the following implications for the Canadian fixed income markets.
Lower Growth
The most obvious effect of losing easy access to our largest export market will be lower short- and medium-term growth. Although other markets can be developed and accessed, the U.S. has always been the "low-hanging fruit," and growth will necessarily be lower in the period when producers diversify, where possible. GDP growth was unimpressive before the tariff event and will likely be even lower for some time. Expect a low value for the Canadian dollar versus other, higher growth, currencies, and low real yields in Canada.
Lower Nominal Yields
Canadian fixed income markets have already concluded that yields will be lower in Canada than in the U.S. We feel this market reaction is correct. The Bank of Canada will need to sacrifice Canadians' standard of living through the depreciation of the Canadian dollar while it pursues easy monetary policy to stave off recession or recessionary tendencies. We believe this will be the case for many years to come and suspect that the days of Canadian 2-year and other yields exceeding those of the U.S., such as those periods highlighted in Figure 3, will not be observed again for some time.
Figure 3
CAN, UST 2Y Constant Maturity Bond Yields
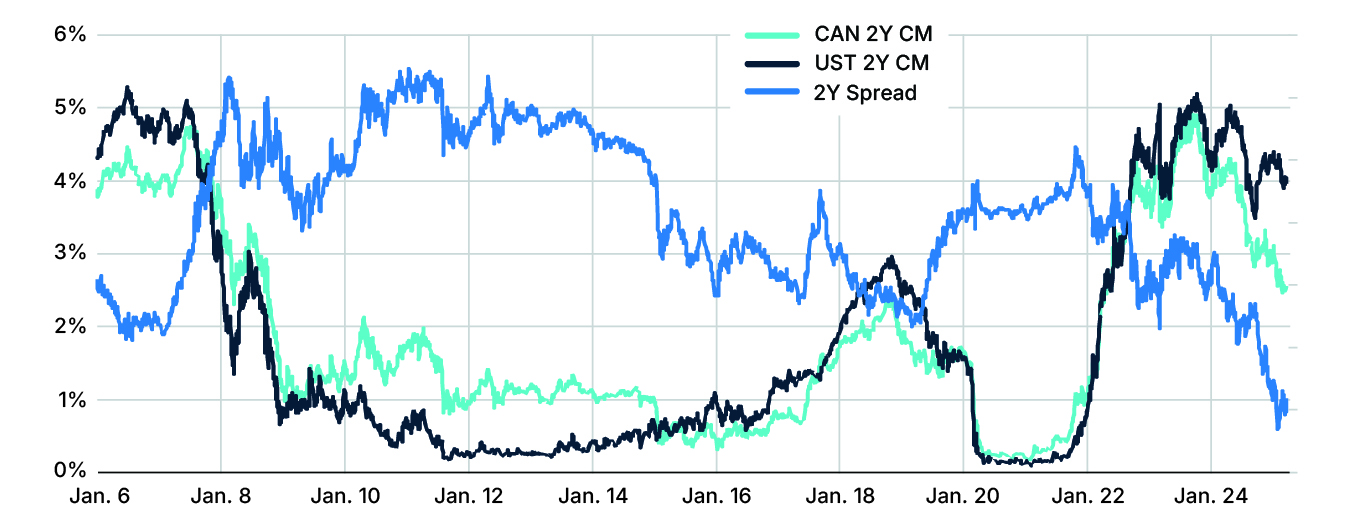
Source: BMO Capital Marketsi Fixed Income Sapphire database
Lower Correlation
Decoupling the two nations' markets will lower the correlation between bond yields and changes to bond yields to unprecedented levels in recent financial market history. We suggest that mean reversion trades between 2-year yield levels may remain viable for several years, especially if the tariff war is resolved, but that looking out to 5-year and 10-year terms, yields between the two countries should diverge permanently.
We doubt that, in the medium term, strong mean reversion of the type shown in Figure 4, which depicts the period from summer 2010 to summer 2013, will be observed again for some time. Perhaps, 90% of Canada's 10-year yield may be explained in future by a multiple regression of European yields and U.S. yields rather than by U.S. yields alone.
Figure 4
CAN 5Y Yield less UST 5Y Yield
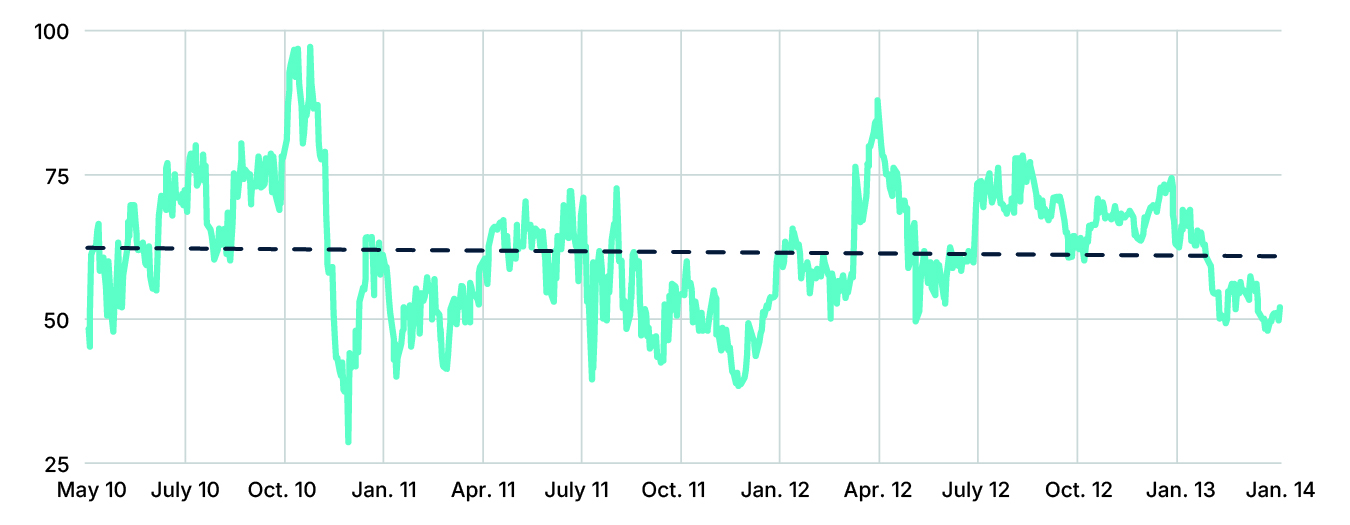
Source: BMO Capital Marketsi Fixed Income Sapphire database
Implications For Market Participants
The implications of these changes are not limited to risk-taking trades but also affect the interest rate hedging world. Many bank trading desks still hedge large interest rate exposures with U.S. treasuries, especially during illiquid times in the Canadian markets. This hedge has been, and will be, much more volatile in the future than it was in the past.
Moreover, risk-seeking participants who delve into U.S. markets may consider higher U.S. yields attractive enough to participate in that market instead of lower-yielding Canadian bonds but beware that the days of counting on U.S. treasuries as a low-risk proxy for Canadian bonds is steadily moving toward an end. Trading a sharp move away from the historical mean, like the 10-year bond yield spread in Figure 5, with an expectation of mean reversion, could be profitable but should no longer be taken for granted.
Figure 5
CAN, UST 10Y Constant Maturity Bond Yields
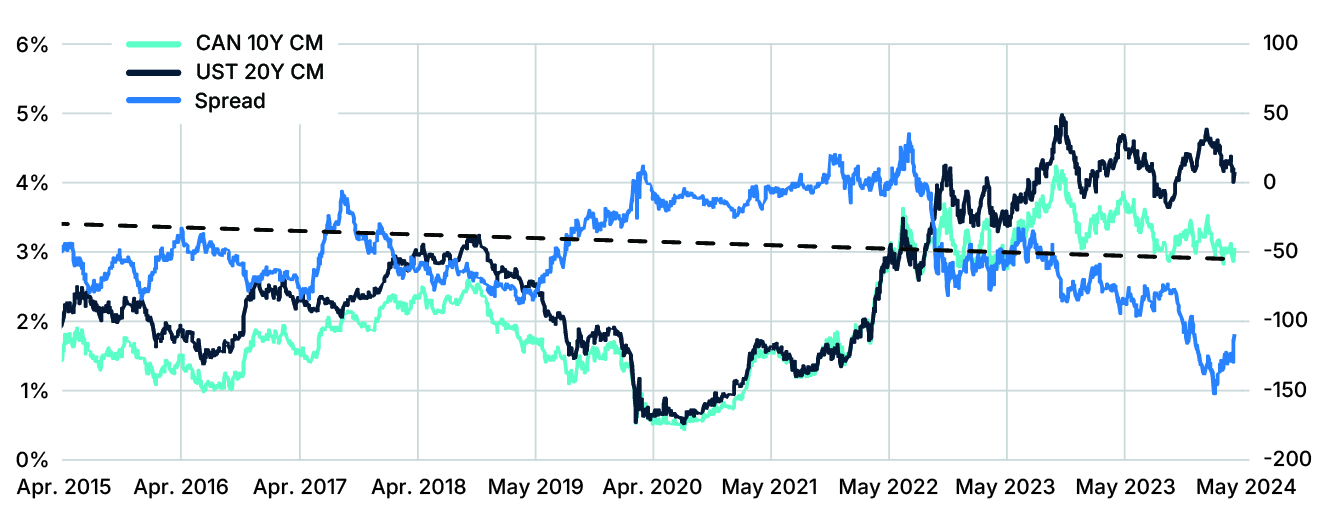
Source: BMO Capital Marketsi Fixed Income Sapphire database
[1] The original free trade agreement between the two regions dates to the Reciprocity Treaty (1855) which was cancelled by the United States and dates to before Canada was an independent country.
[2] The predecessor of the North American Free Trade Agreement (1994) which admitted Mexico. All were predecessors of the United States–Mexico–Canada Agreement (2020).
[3] Or, at least, retained the appearance of strength such that normal bank operations continued.
[4] Less true for equity indices due to significant differences in their composition.
[5] RealClearPolitics, President Trump Job Approval, April 8, 2025.
[6] World Bank
[7] Statistics Canada
[8] The final month of December 2020, for instance, was just 68%, although strongly influenced by the COVID-19 pandemic.
i BMO Capital Markets is a trade name used by BMO Financial Group for the wholesale banking business of Bank of Montreal, BMO Harris Bank N.A. (member FDIC), Bank of Montreal Ireland plc., and Bank of Montreal (China) Co. Ltd and the institutional broker dealer businesses of BMO Capital Markets Corp. (Member SIPC) in the U.S., BMO Nesbitt Burns Inc. (Member Canadian Investor Protection Fund) in Canada and Asia and BMO Capital Markets Limited (authorized and regulated by the Financial Conduct Authority) in Europe and Australia. "BMO Capital Markets" is a trademark of Bank of Montreal, used with permission.
Copyright © 2025 Bourse de Montréal Inc. All rights reserved. Do not copy, distribute, sell or modify this document without Bourse de Montréal Inc.'s prior written consent. This information is provided for information purposes only. The views, opinions and advice provided in this article reflect those of the individual author. Neither TMX Group Limited nor any of its affiliated companies guarantees the completeness of the information contained in this publication, and we are not responsible for any errors or omissions in or your use of, or reliance on, the information. This publication is not intended to provide legal, accounting, tax, investment, financial or other advice and should not be relied upon for such advice. The information provided is not an invitation to purchase securities listed on Montreal Exchange, Toronto Stock Exchange and/or TSX Venture Exchange. TMX Group and its affiliated companies do not endorse or recommend any securities referenced in this publication. BAX, CRA, CGZ, Montréal Exchange, MX and OCR are the trademarks of Bourse de Montréal Inc. TMX, the TMX design, TMX Group, Toronto Stock Exchange and TSX Venture Exchange are the trademarks of TSX Inc. and are used under license.