
Mastering Options Trading: A Beginner's Guide to the Montréal Exchange Option Calculator

Options trading can seem as complex as navigating a dense forest, but with the right tools, you can chart a clear path. The Montréal Exchange (MX) offers a powerful compass in the form of an online option calculator. This free tool helps you understand and calculate the theoretical value of options, making it easier to plot your course in the world of Canadian equity, ETF, index, and currency options.
What is the MX Option Calculator?
Think of the MX Option Calculator as your financial GPS. Just as a GPS helps you navigate unfamiliar streets, this calculator guides you through the intricate landscape of options trading. It's designed to evaluate the premium of various Canadian financial instruments, whether you're dealing with American or European style options.
Why use the MX Option Calculator?
Imagine you're planning a road trip. You wouldn't set out without first estimating your fuel costs, travel time, and potential pit stops. Similarly, the MX option calculator helps you plan your investment journey by:
- Estimating potential returns
- Assessing risk
- Making informed decisions
You can input real market data or use theoretical scenarios, allowing you to explore various investment possibilities before committing to a trade.
Understanding Option Styles: American vs. European
Before we dive into the calculator's inputs, it's crucial to understand the difference between American and European style options. This is like choosing between a flexible ticket (American) and a fixed date ticket (European) for a flight.
- European-style options: These are like non-refundable, fixed-date flight tickets. You can only exercise them on the expiration date. Examples include currency options like those on the US dollar (USX).
- American-style options: These are like flexible flight tickets. You can exercise them at any time on or before the expiration date. Options on stocks and ETFs fall into this category.
Key Inputs for the Option Calculator
Here are the essential pieces of information you'll need to input, along with their definitions and helpful analogies:
Type of Underlying: The specific asset on which the option contract is based.
Analogy: This is like choosing your main ingredient in a recipe. It could be a stock, ETF, index, or currency.
Option Type: Specifies whether the option is a call (right to buy) or a put (right to sell).
Analogy: This is your basic strategy - are you betting the price will rise (call) or fall (put)?
Expiration Date: The date when the option contract becomes void if not exercised.
Think of this as the "best before" date on your option. It's when your option "expires" and can no longer be used.
Strike Price: The predetermined price at which the underlying asset can be bought (for a call) or sold (for a put) if the option is exercised.
Analogy: This is your target price, like setting a goal for a sports team to beat.
Underlying Price or Current Price: The current market price of the underlying asset.
Analogy: This is today's "temperature" of the asset - its current value in the market.
Volatility: A measure of the expected fluctuation in the underlying asset's price over time, typically expressed as an annualized percentage.
Analogy: Imagine this as the "mood swings" of the stock price - how much it tends to go up and down.
Interest Rate: The risk-free interest rate for the period corresponding to the option's time to expiration.
Analogy: This is like the cost of borrowing money to buy the stock instead of the option. It's usually based on government bond rates.
Dividend Amount: The expected cash distributions paid out to shareholders of the underlying asset during the option's lifetime.
Analogy: If the company pays dividends, this is like a loyalty bonus for shareholders, expressed as a dollar amount per share.
Days to Expiration: The number of calendar days remaining until the option contract expires and becomes invalid if not exercised.
Analogy: Think of it as a countdown timer on a special coupon. The more days left, the more time you have for prices to change in your favour, potentially making your coupon more valuable. As the expiration approaches, the coupon's value typically decreases, just like an option tends to lose value over time.
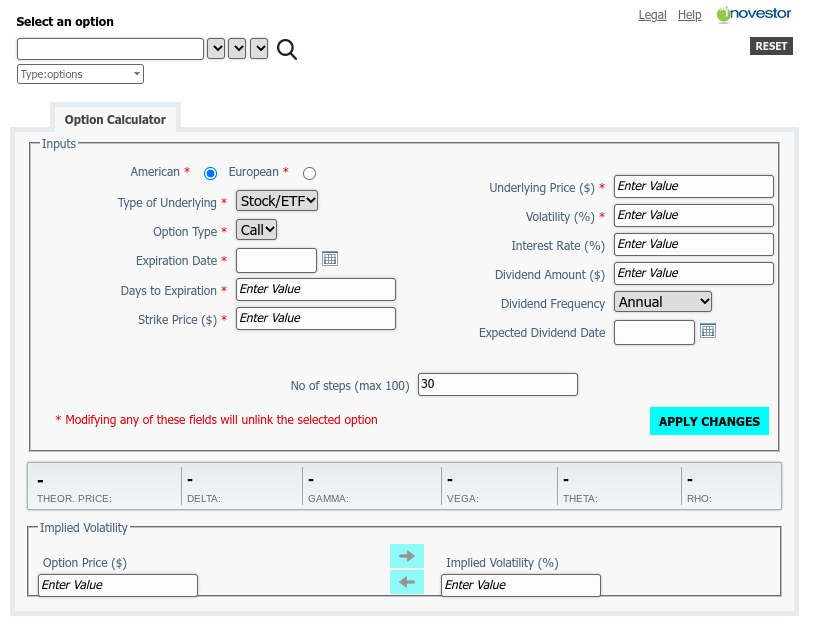
Step-by-Step Guide to Using the Montreal Exchange Option Calculator
1. Access the calculator
2. Select the option style (American or European) at the top of the calculator.
3. Input all required data into the calculator.
4. Click "APPLY CHANGES" to generate results.
5. Review the "Theoretical Price". This is the theoretical fair value of the option based on your inputs.
6. Examine each of the Greeks. These are special numbers that give you more information about the option. For now, focus on Delta and Theta.
- Delta: Indicates how much the option price might change for a $1 move in the underlying asset.
- Gamma: Shows how delta might change for a $1 move in the underlying asset.
- Vega: Reflects how much the option price might change for a 1% change in volatility.
- Theta: Indicates how much value the option might lose each day, all else being equal.
- Rho: Shows how sensitive the option is to interest rate changes.
7. Consider how these values interact with your market outlook and trading strategy.
8. Compare the calculated option price with the market price to identify potential over- or under-valued options.
9. Experiment with different inputs to understand how changes in various factors affect the option's price and Greeks. This manual adjustment of parameters allows you to explore different scenarios and market conditions.
Decoding the Results: Option Pricing and the 'Greeks'
After inputting all this information and hitting 'APPLY CHANGES', you'll receive not just the theoretical price of the option, but also five important measures known as the "Greeks". These are like the vital stats of your investment journey:
Delta
Delta measures the rate of change in the option's price with respect to the change in the underlying asset's price.
Analogy: It's like your speed indicator. If delta is 0.5, it means for every $1 move in the stock price, the option price is expected to change by $0.50.
Gamma
Gamma represents the rate of change in delta with respect to the underlying asset's price.
Analogy: Think of it as your acceleration. It shows how quickly delta changes as the stock price moves, indicating how rapidly your option's price sensitivity might change.
Vega
Vega measures the rate of change in the option's price with respect to the change in the underlying asset's implied volatility.
Analogy: This is like your suspension system, showing how well you handle bumps. It indicates how much your option's price might change with a 1% change in volatility.
Theta
Theta represents the rate of change in the option's price with respect to the passage of time, assuming all other factors remain constant.
Analogy: It's the depreciation rate of your investment vehicle. Theta shows how much value your option loses each day as it approaches expiration.
Rho
Rho measures the rate of change in the option's price with respect to the change in the risk-free interest rate.
Analogy: Consider this your fuel efficiency rating. It indicates how sensitive your option's price is to changes in interest rates.
Understanding these "Greeks" is crucial for options traders as they provide insights into how various factors affect option prices. Just as you wouldn't drive a car without understanding its dashboard, these metrics give you a comprehensive view of your option's behaviour under different market conditions.
Real-World Application: A Practical Example
Using the Montréal Exchange Option Calculator, let's analyze a call option for a fictional company, MapleGrove Syrup (MGS):
- Current underlying or stock price: $50
- Strike price: $55
- Days to expiration: 30
- Risk-free interest rate: 2% (annualized)
- Volatility: 25% (annualized)
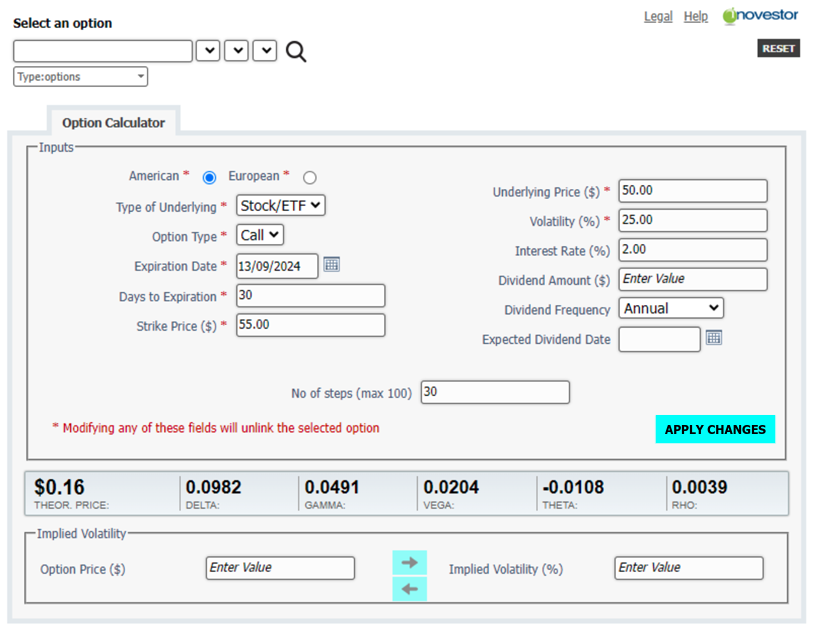
After inputting these details, you might see results similar to:
- Option Price: $0.16
- Delta: 0.0982
- Theta: -0.0108
What does this mean?
- The calculator estimates the option's theoretical value at $0.16 per share.
- The Delta of 0.0982 suggests that if MapleGrove Syrup stock price increases by $1, your option might increase in value by approximately $0.0982.
- The Theta of -0.0108 indicates that, all else being equal, the option might lose about $0.0108 in value each day just due to time passing.
Remember, while these measures are powerful tools for analysis, they're based on theoretical models and assumptions. Real-world market conditions can sometimes deviate from these models, so it's important to use the Greeks as guides rather than absolute predictors.
Conclusion
By mastering the use of the Montréal Exchange option calculator and understanding the "Greeks", you're taking a significant step towards becoming a more informed and confident options trader in the Canadian market. Remember to start small, continue learning, and always consider your risk tolerance when making investment decisions. Happy calculating, and safe trading!
Disclaimer:
The strategies presented in this article are for information and training purposes only, and should not be interpreted as recommendations to buy or sell any security. As always, you should ensure that you are comfortable with the proposed scenarios and ready to assume all the risks before implementing an option strategy.
Copyright © 2024 Bourse de Montréal Inc. All rights reserved. Do not copy, distribute, sell or modify this document without Bourse de Montréal Inc.'s prior written consent. This information is provided for information purposes only. Neither TMX Group Limited nor any of its affiliated companies guarantees the completeness of the information contained in this publication, and we are not responsible for any errors or omissions in or your use of, or reliance on, the information. This publication is not intended to provide legal, accounting, tax, investment, financial, or other advice and should not be relied upon for such advice. The information provided is not an invitation to purchase securities listed on Montreal Exchange, Toronto Stock Exchange, and/or TSX Venture Exchange. TMX Group and its affiliated companies do not endorse or recommend any securities referenced in this publication. Montréal Exchange and MX are the trademarks of Bourse de Montréal Inc. TMX, the TMX design are the trademarks of TSX Inc. and are used under license.