
Insights on CDR Options Liquidity

As the final article of our five‑part series on Canadian Depositary Receipts (CDR) options wraps up, it is time to examine not only where liquidity exists but also how this emerging market has fared under real-world conditions. We begin by examining the core aspects of this market: symbol concentration, volume, open interest, and time‑to‑expiry segmentation, combined with real‑world stress‑test anecdotes to illustrate why this market has quickly proven itself.
Daily Trading Volume: From Initial Spike to Steady Baseline
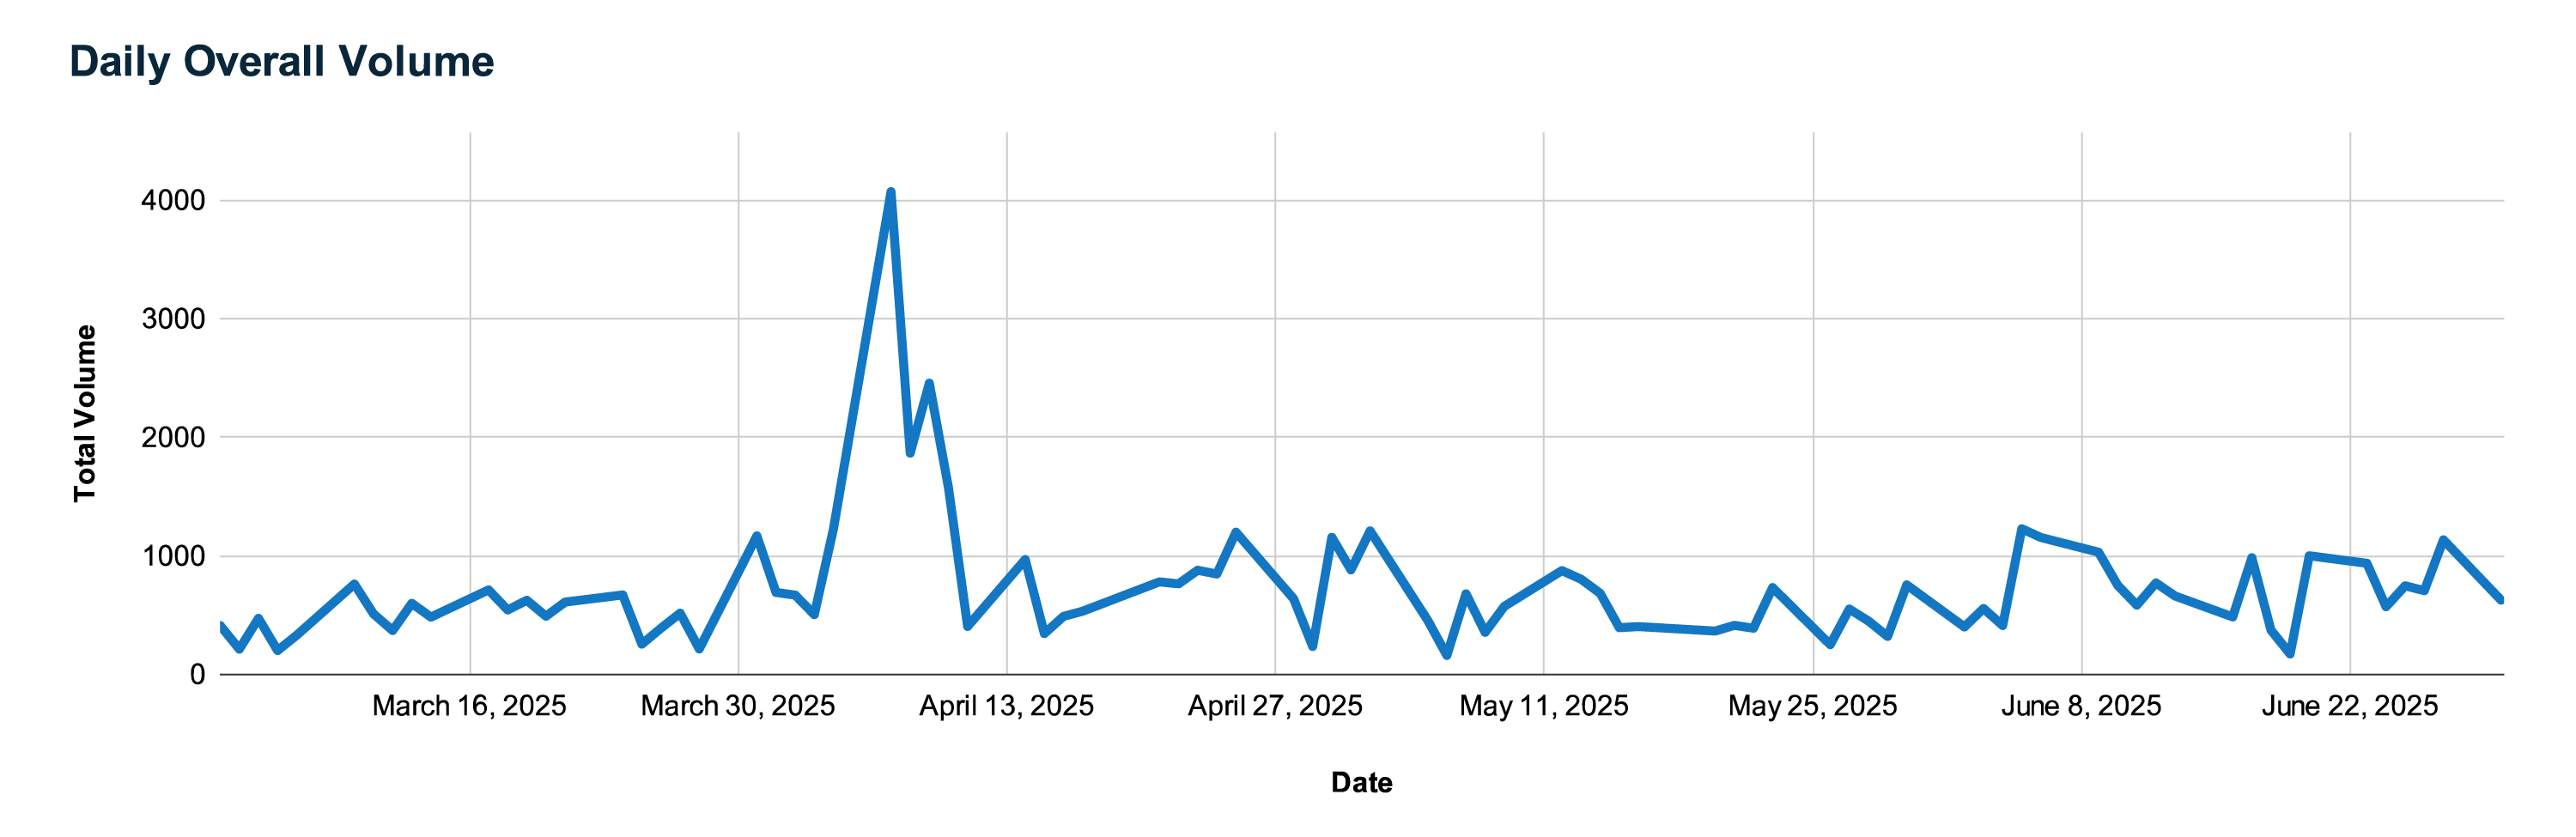
When CDR options debuted in mid-March, activity was understandably modest: fewer than 100 contracts traded each day during the first week. This quickly changed as traders tested the new product, pushing daily volume above 1,000 contracts within ten trading days. The true turning point occurred around the first combined weekly and monthly expiries in early April, when volume surged past 4,000 contracts, driven by both speculative scalping and systematic roll strategies. In the weeks that followed, trading established a steady rhythm: each session now sees roughly 600 to 900 contracts traded, even on days without major corporate announcements. This baseline suggests that participants can typically execute orders of five to twenty contracts without significant concern about illiquid markets or unpredictable fills.
Volume Concentration: High-Beta Names Take the Lead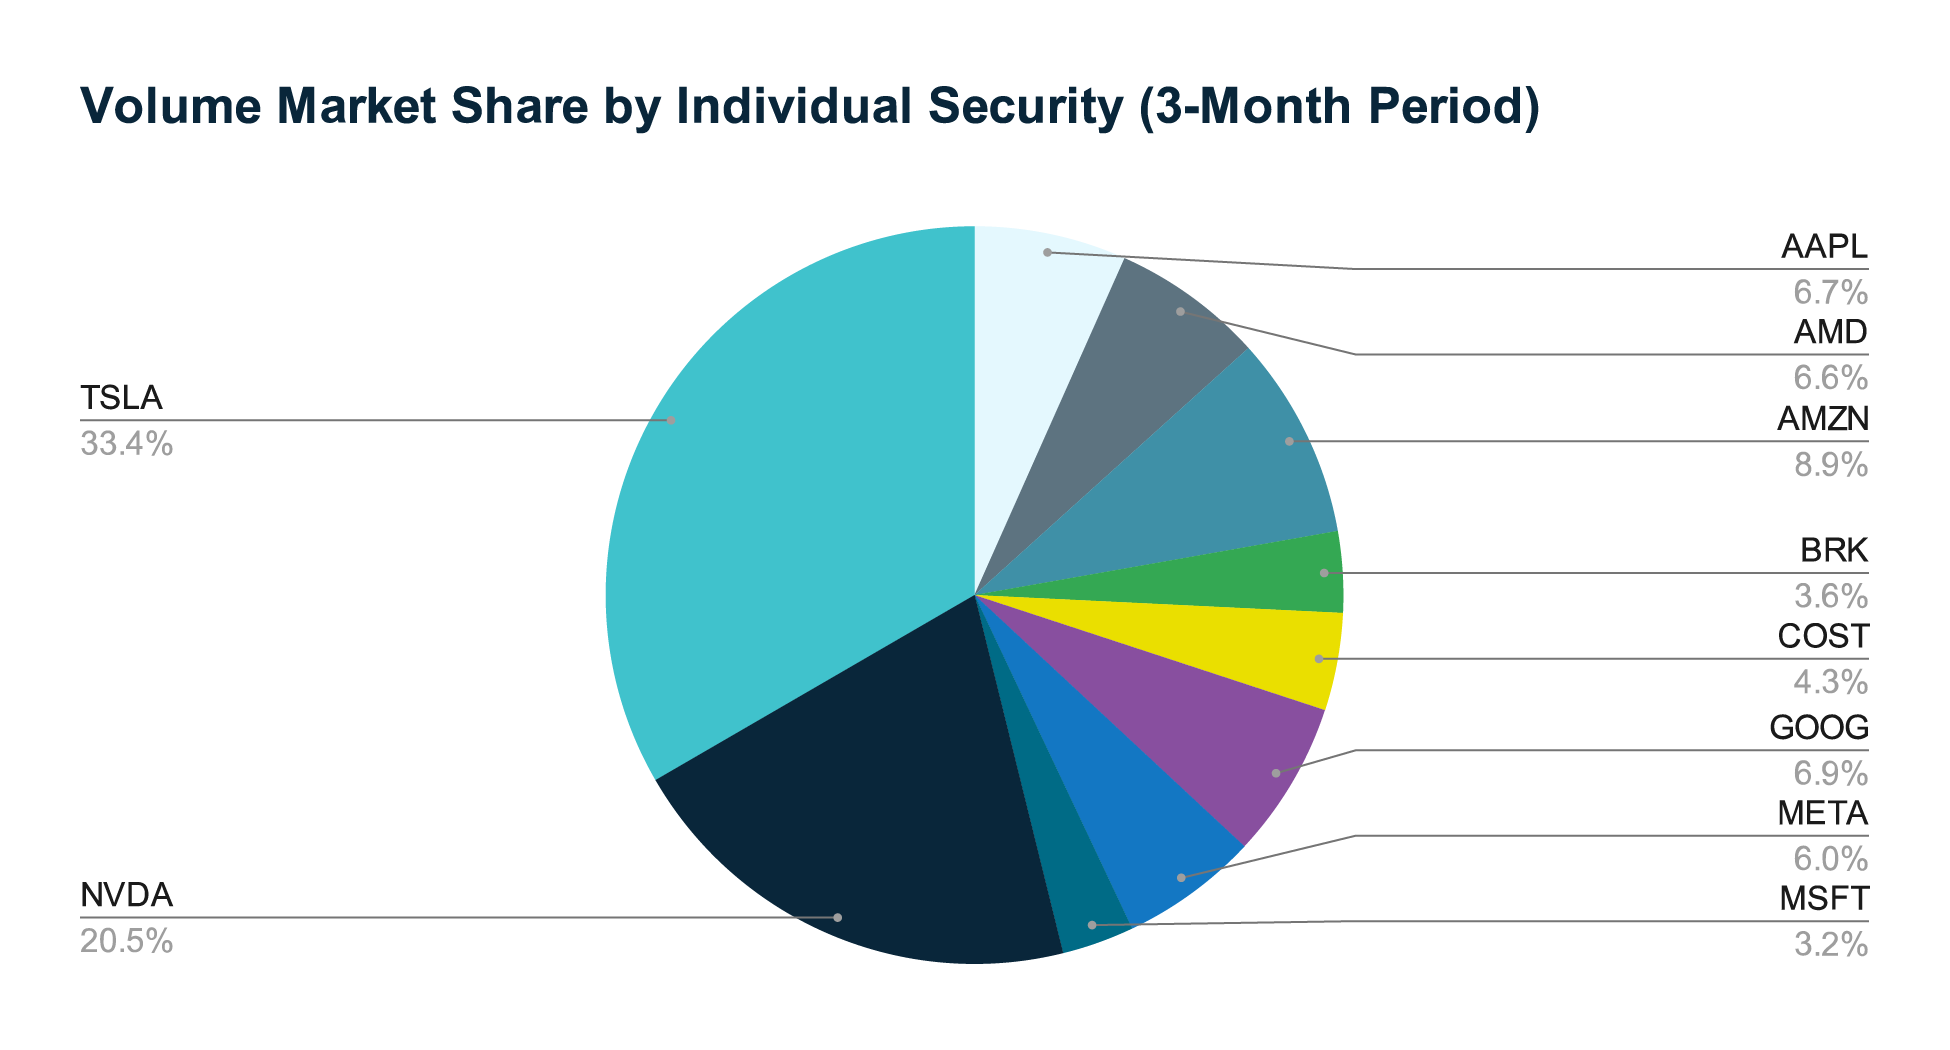
Beneath the headline totals, trading focused heavily on a few underlyings. Tesla CDR (CAD Hedged) and Nvidia CDR (CAD Hedged) alone account for more than half of all CDR options volume, with the former at about 33 percent and the latter at 20 percent. The next group—Amazon.com CDR (CAD Hedged), Alphabet CDR (CAD Hedged) and Apple CDR (CAD Hedged)—together make up roughly another 25 percent, leaving a long tail of six other names to split the remainder. This concentration indicates that high-beta, news-driven names dominate trading activity, as market participants position themselves around earnings, product launches, and macro events.
Overall Open Interest: Rapid Growth, Stable Plateau
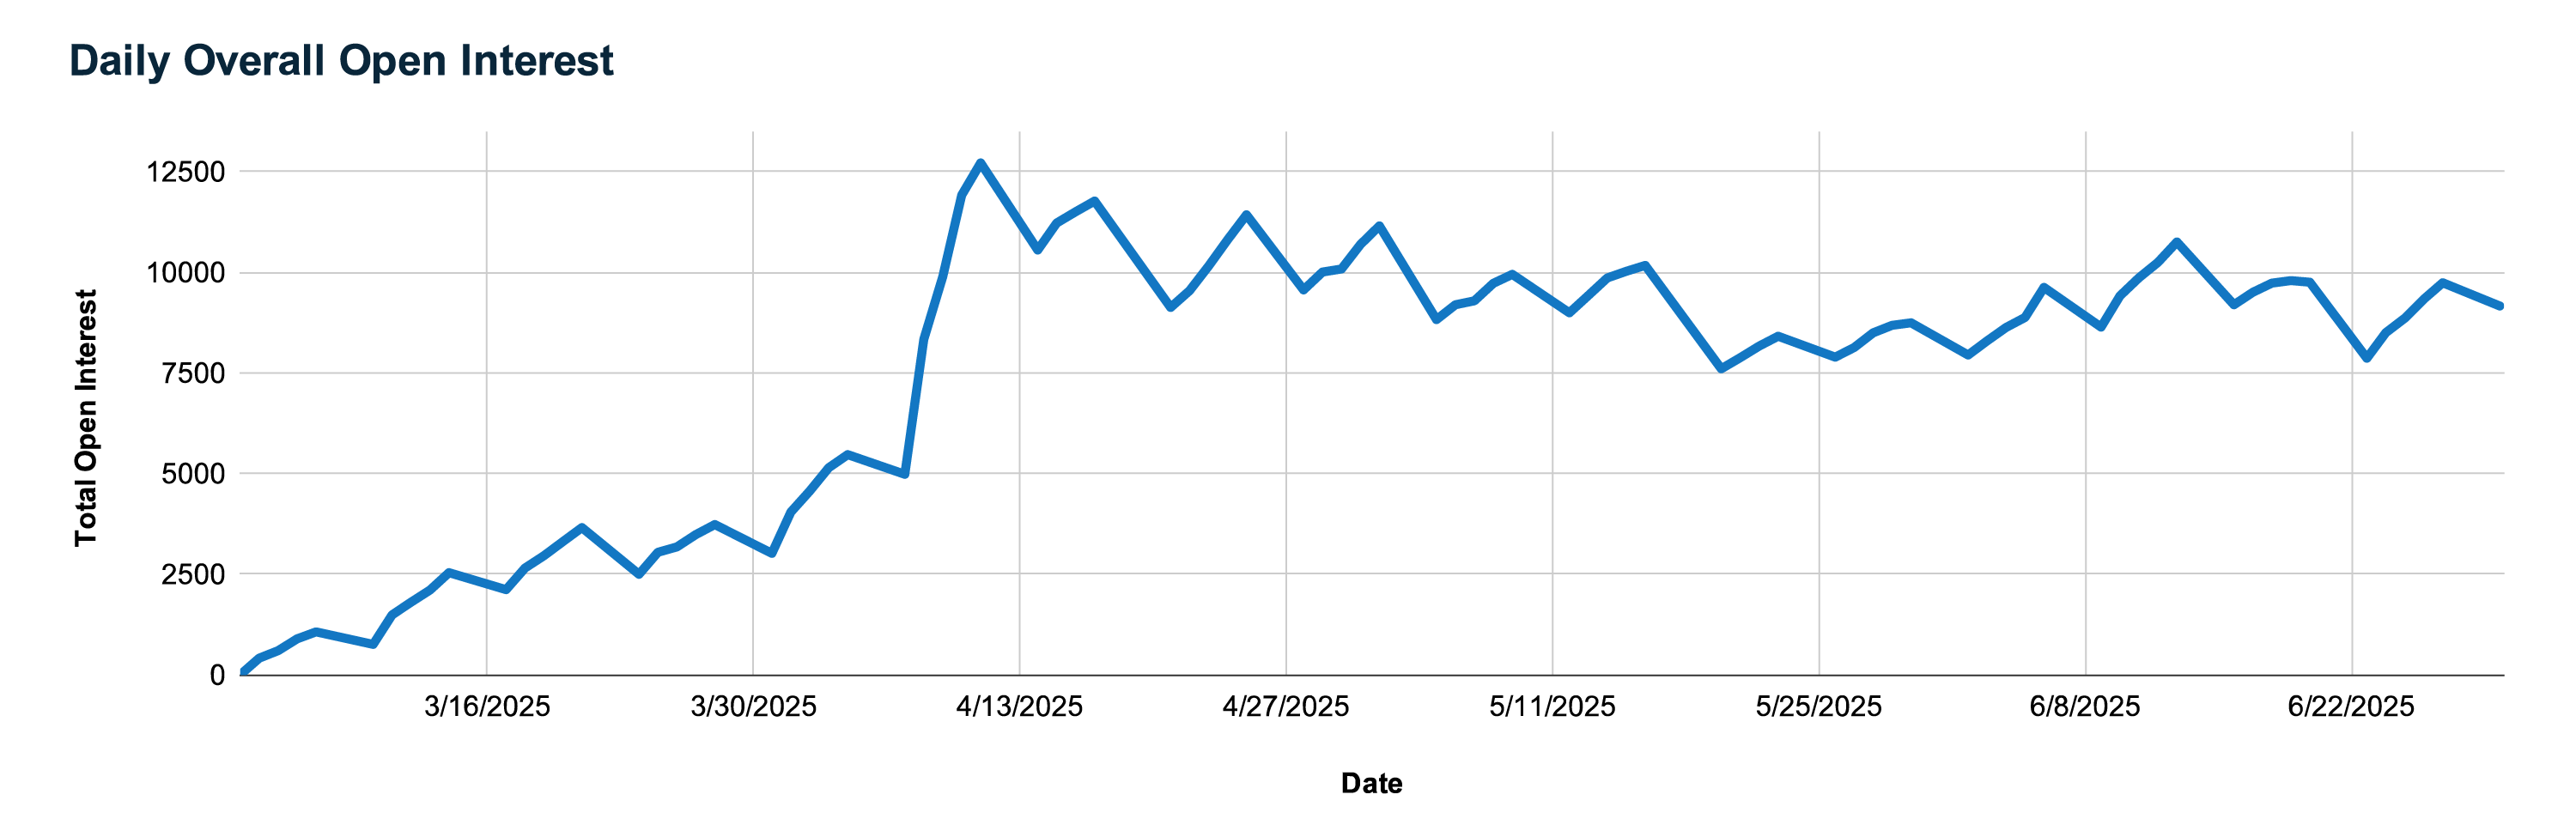
Open interest has followed a similar path. From nearly zero at launch, outstanding CDR options positions surged past 12,000 contracts by mid-April, reflecting both new trades and many positions rolled from one cycle to the next. In the ensuing weeks, open interest stabilized between 8,000 and 11,000 contracts, fluctuating with weekly and monthly expirations but never collapsing. The continuity of this plateau across multiple roll dates confirms that market participants are not merely fleetingly curious; they are establishing and maintaining positions for hedging, income, and directional purposes.
Open Interest Concentration: Where Commitment Truly Runs Deep
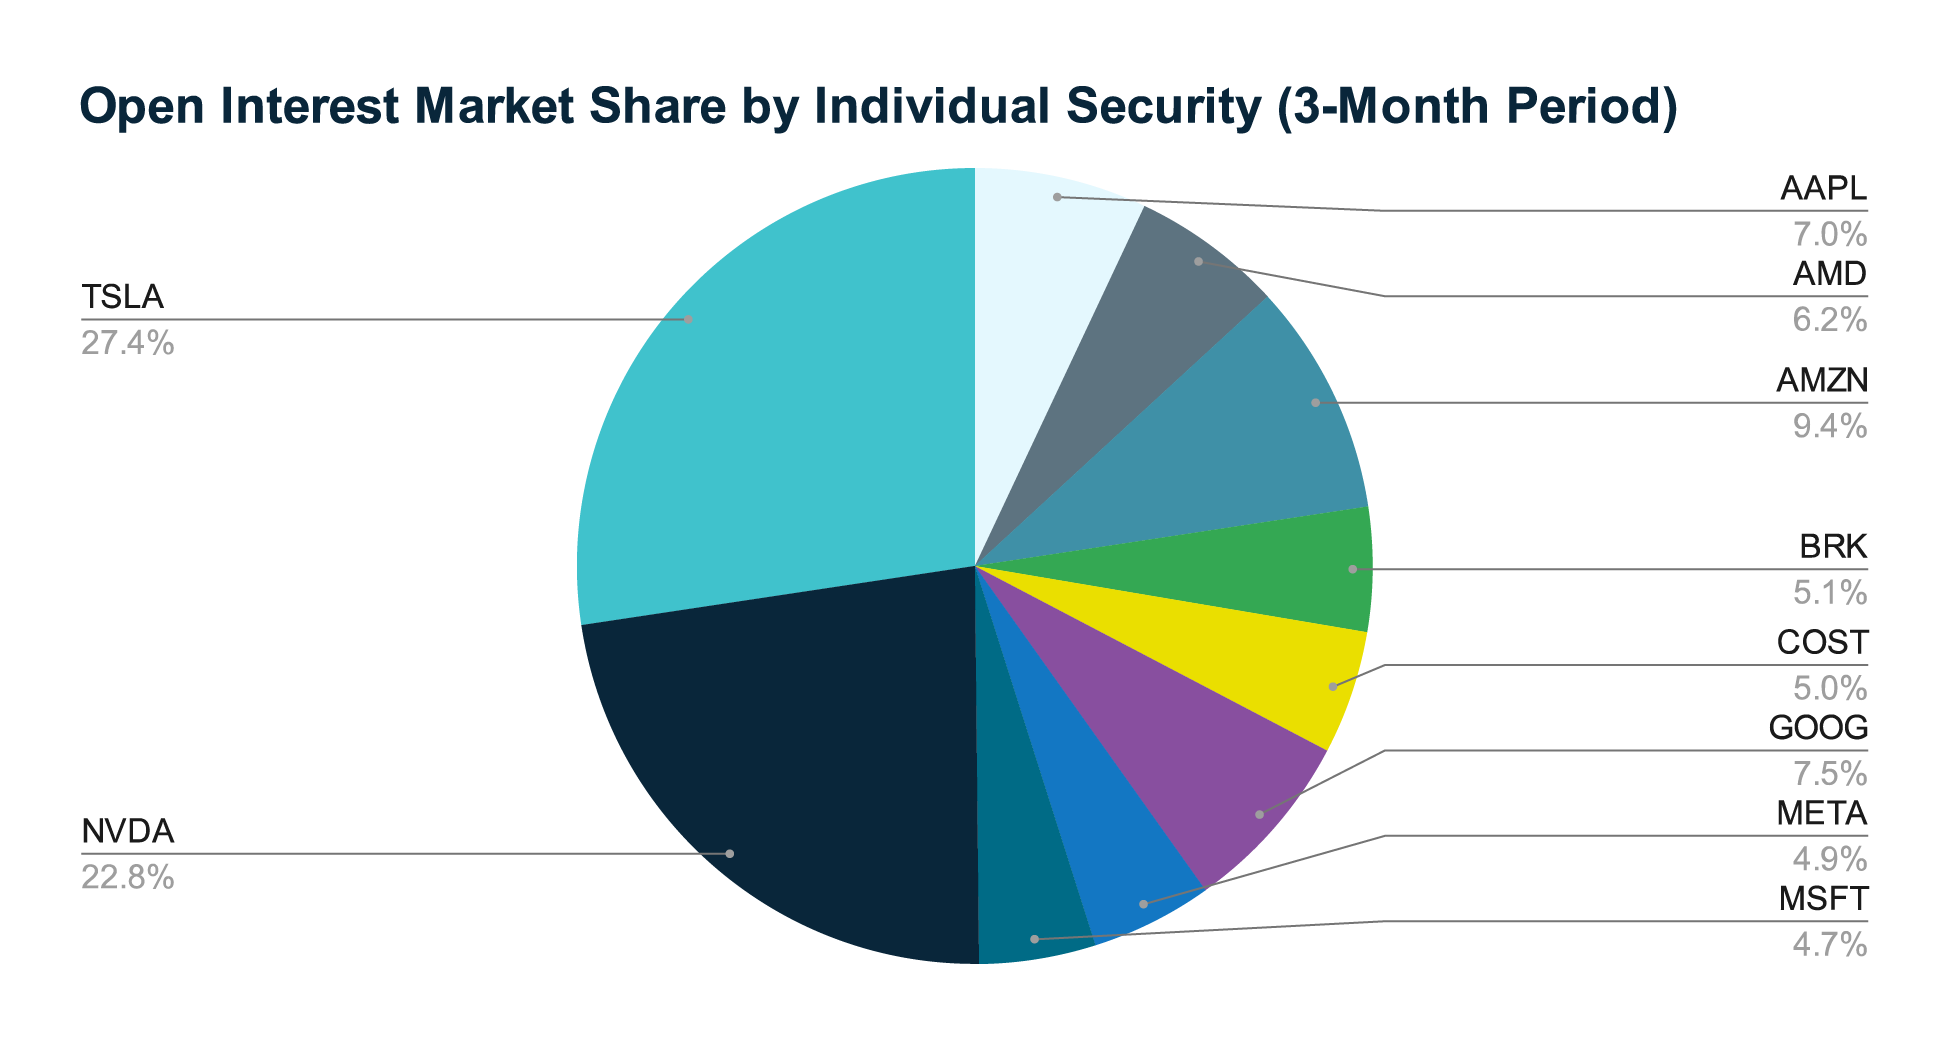
Just like with volume, open interest is mainly focused on the top tier of underlyings. Tesla CDR (CAD Hedged) commands roughly 27 percent of total open contracts, followed by Nvidia CDR (CAD Hedged) at 23 percent. Amazon.com CDR (CAD Hedged), Alphabet CDR (CAD Hedged) and Apple CDR (CAD Hedged) each command 7% - 9.4% market share, while the remaining six names split the last quarter. This distribution indicates where significant pools of resting liquidity may be located. In those top five tickers, market participants might see both higher turnover and notable queued interest at various strikes. This concentration pattern shows that these securities tend to support deeper two-sided markets.
Expiry-Bucket Analysis: Liquidity by Time Horizon
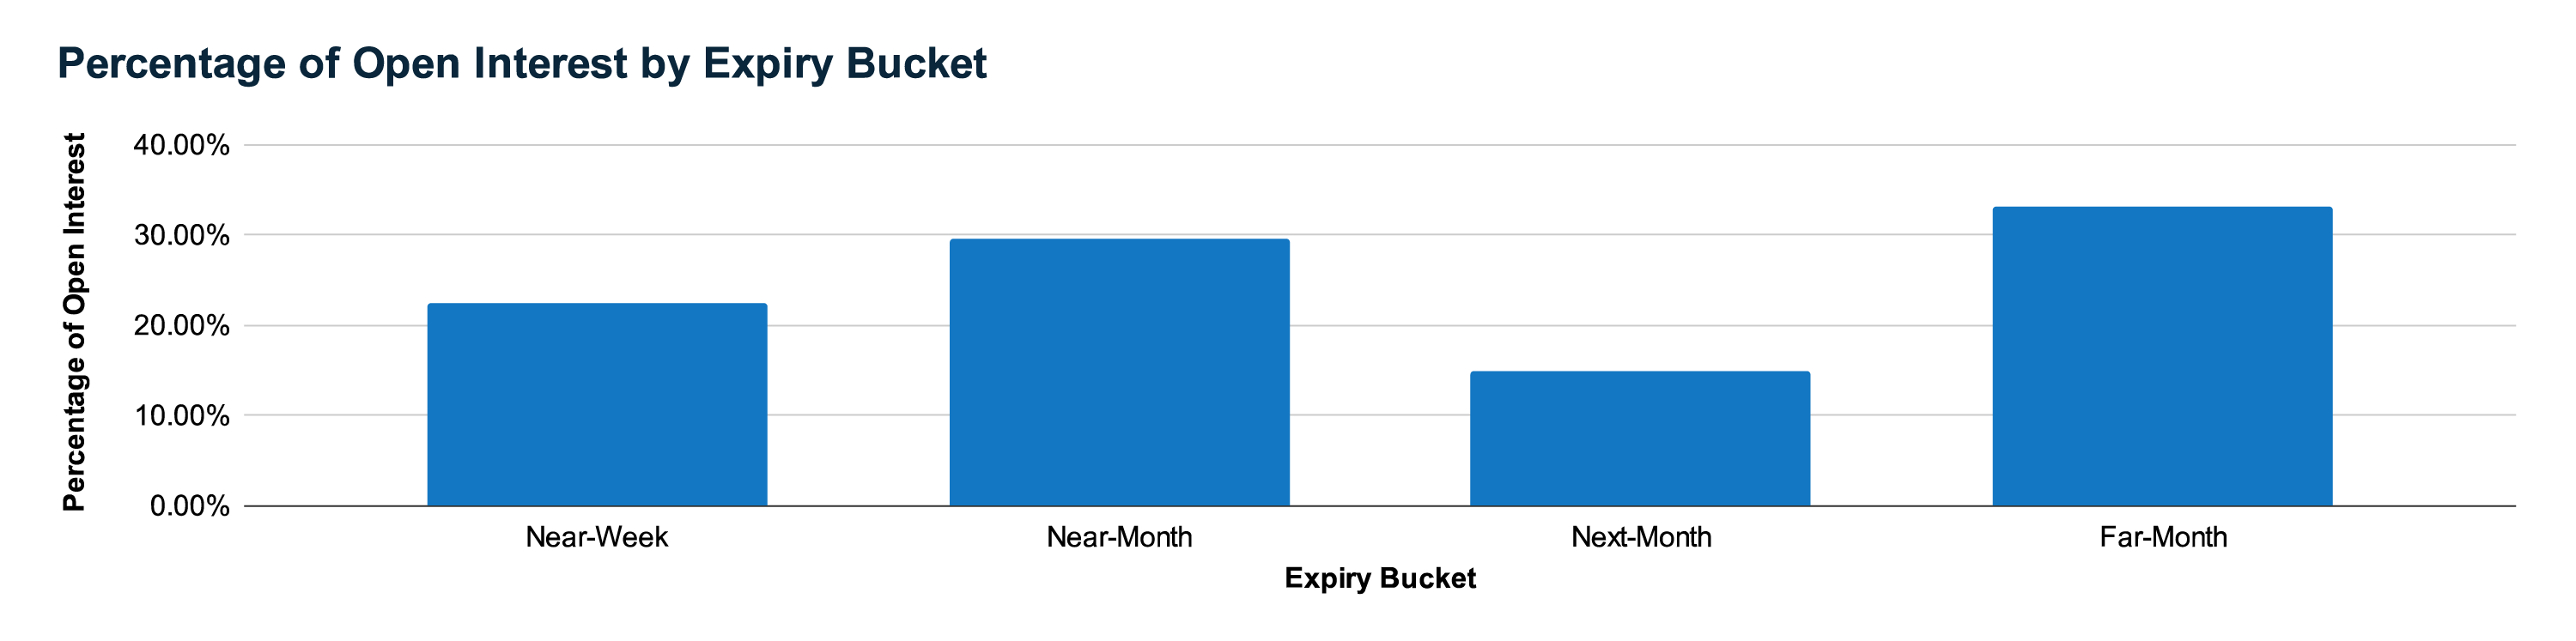
To align strategy with execution quality, we classify every contract into one of four "time-to-expiry" buckets: Near-Week (0–7 days), Near-Month (8–30 days), Next-Month (31–60 days), and Longer-Dated (> 60 days). Although the bar charts are not shown here, the underlying data reveal the following distribution:
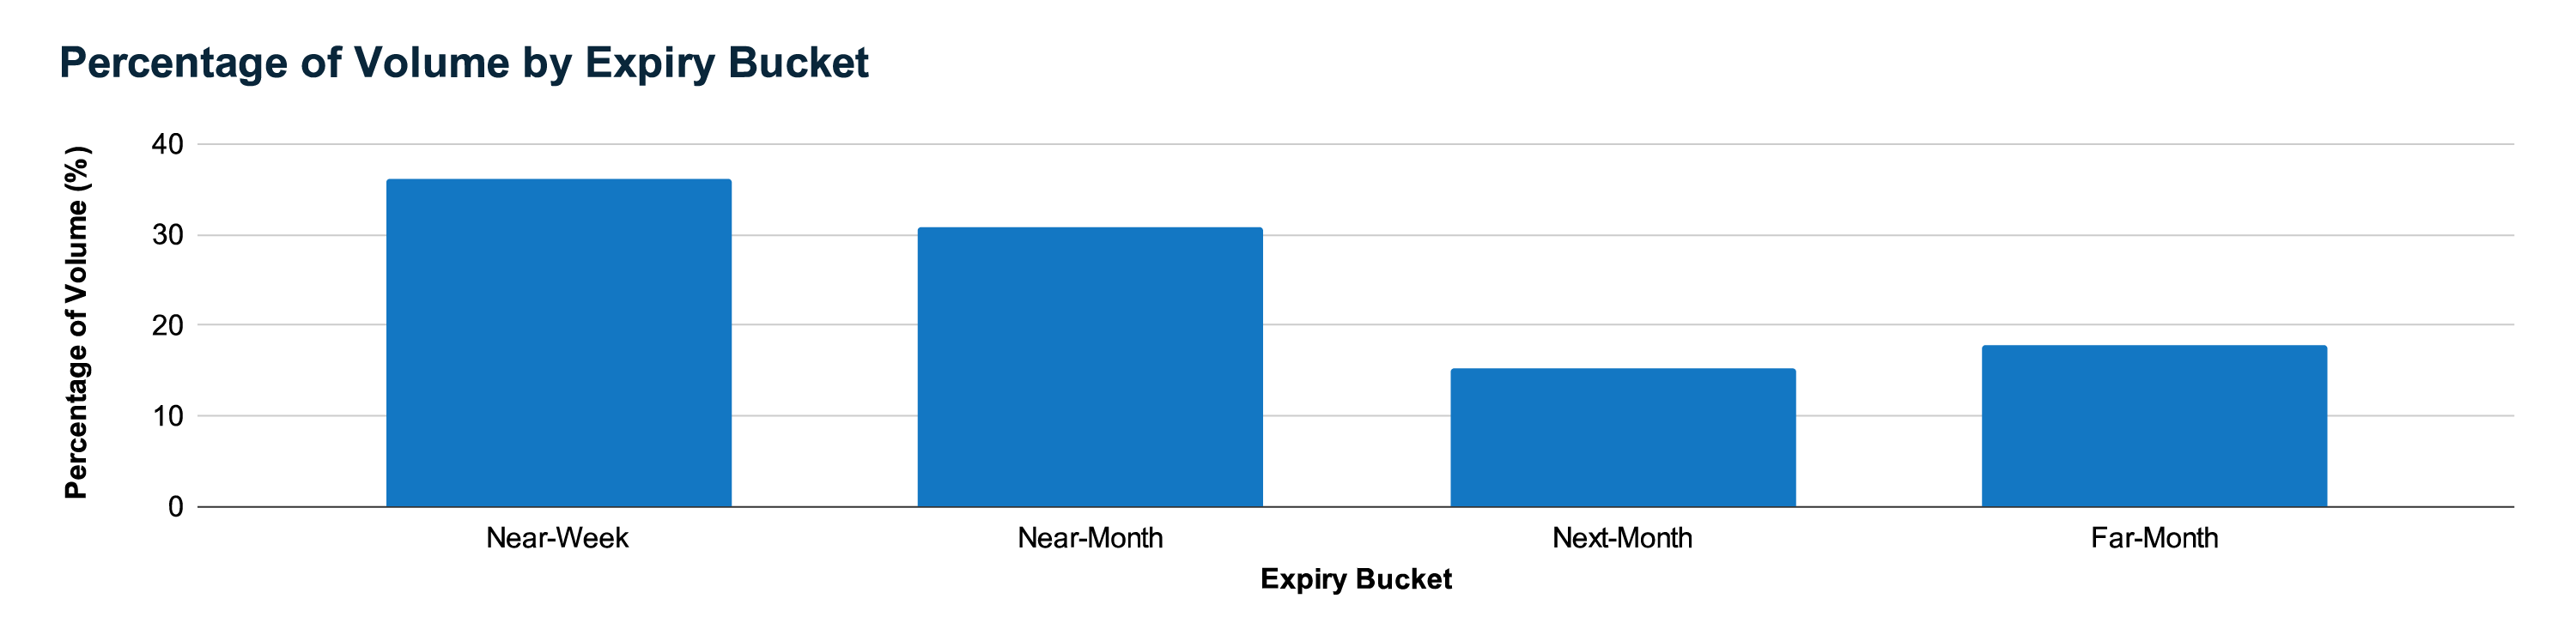
Near-week contracts make up 36.7 percent of total volume but just 22.3 percent of open interest. This positions them in the arena of gamma scalpers and event traders who value churn and immediacy, accepting lower stickiness in exchange for rapid turnover.
Near-month expiries account for 30.5 percent of volume and 29.8 percent of open interest, striking the optimal balance for covered calls, protective puts, and defined-risk spreads that require both reasonable turnover and the ability to hold through major events.
Next-month activity drops to 15.2 percent of volume and 15.1 percent of open interest, a window best suited to calendar spreads and strategic roll-outs when your outlook extends just beyond the front cycle.
Longer-dated contracts, while only 17.6 percent of volume, dominate 33.8 percent of open interest, illustrating institutional and strategic retail hedges that carry exposures over multiple months.
By matching your trade horizon to the bucket where depth and persistence align whether you are scalping weekly gamma, earning premium monthly, or hedging multi-month market views you gain the confidence that your orders will find natural counterparties without causing excessive market impact.
Conclusion: A Liquid, Layered Marketplace
From its early days of calibration to its rapid ascent in volume, concentration in marquee names, and stable open interest levels, the CDR options market has developed into a granular, time-segmented ecosystem. Retail participants can now navigate each layer of liquidity, from the hectic near-week churn to the strategic longer-dated hedge, with data-driven precision.
This liquidity analysis brings our five-part exploration of CDR options to a close. Throughout this series, we started with the CDR options fundamentals, examining their unique structure and market positioning. We then explored their pricing mechanisms and contract specifications, providing the technical foundation every trader needs. Our third installment compared CDR options to traditional U.S. options and highlighted several key benefits including the elimination of currency-related complexities. The fourth article demonstrated how investors can build complete portfolios using CDR options to match their specific investment objectives and risk profiles. With today's liquidity insights completing the picture, you now have the complete toolkit needed to navigate this evolving marketplace with confidence and precision.
Copyright © 2025 Bourse de Montréal Inc. All rights reserved. Do not copy, distribute, sell or modify this document without Bourse de Montréal Inc.'s prior written consent. This information is provided for information purposes only. Neither TMX Group Limited nor any of its affiliated companies guarantees the completeness of the information contained in this publication, and we are not responsible for any errors or omissions in or your use of, or reliance on, the information. This publication is not intended to provide legal, accounting, tax, investment, financial, or other advice and should not be relied upon for such advice. The information provided is not an invitation to purchase securities listed on Montreal Exchange, Toronto Stock Exchange, and/or TSX Venture Exchange. TMX Group and its affiliated companies do not endorse or recommend any securities referenced in this publication. Montréal Exchange and MX are the trademarks of Bourse de Montréal Inc. Groupe TMX, TMX, the TMX design, TMX Group, Toronto Stock Exchange and TSX Venture Exchange are the trademarks of TSX Inc. and are used under license. All other trademarks used in this publication are the property of their respective owners.