Unpacking a Successful Curve Trade in Canadian Bond Futures
In the month preceding December 21, 2020, a 5-10 curve trade in Canada traded about 30,000 times1. While we do not know how many of these trades were steepening trades for clients facilitated by dealers, or which participants hedged out the curve exposure post-trade, it seems plausible that some clients executed, and held, a very profitable trade in 5-year CGF and 10-year CGB futures during the recent steepening of the Canadian yield curve.
Inter-Group Strategies
An inter-group strategy is the official label for an exchange-traded strategy that involves more than a single instrument (or futures product). In the case study below, we will be discussing a strategy which consists of buying (selling) two CGF contracts and selling (buying) one CGB contract to execute a curve steepening (flattening) trade. The strategy is executed at a single price for all three contracts involved.
Listed strategies exist for several different structures such as CGF versus CGB (5-year-10-year), CGZ versus CGF (2-year-5-year), CGZ versus CGB (2-year-10-year), and even CGZ, CGF and CGB combined (a 2-year-5-year-10-year butterfly trade). The advantage of these strategies is that the trade occurs completely simultaneously and at a single price, so a client can set a limit order and wait for the market to come to them rather than either execute at the going market level or leave an (normally best-efforts) order to work several different trade legs simultaneously at a combined target price.
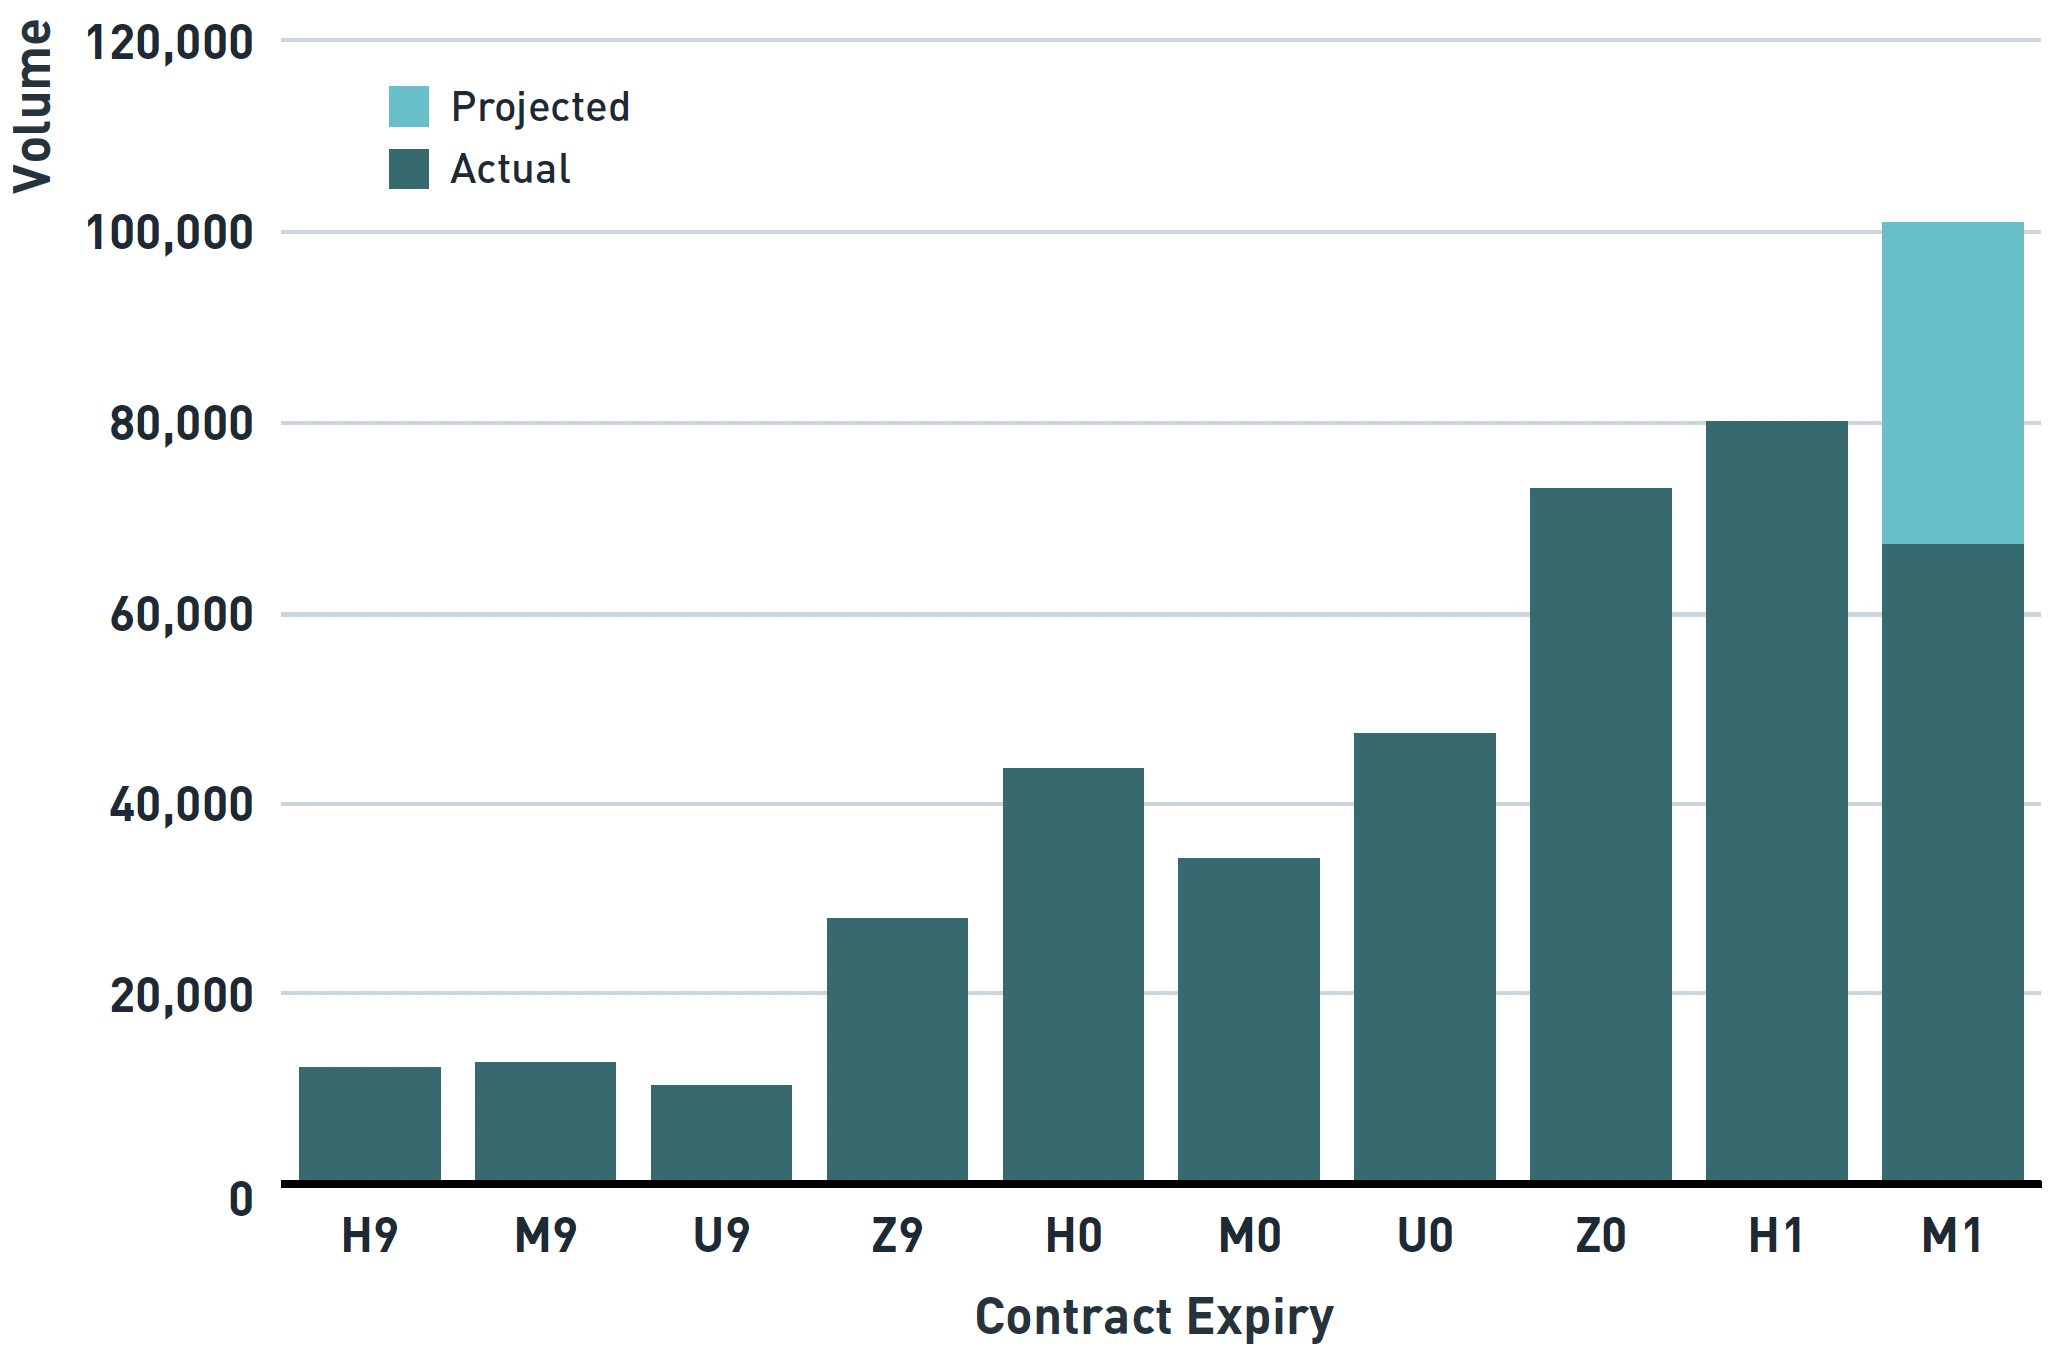
In recent quarters, clients have recognized the simplicity and value of simultaneously executing multiple legs of a futures strategy as demonstrated by increasing volume on the Montréal Exchange, which began in late 2019 and has continued to today. Figure 1 shows the volume over the life of each quarterly contract of a 2CGF – 1 CGB strategy. In rough terms, the volume of this strategy executed in listed inter-group strategies has increased 8-fold from an average of just over 10,000 contracts each quarter to 70,000-80,000 contracts in the most recent full quarter. The projection for M1 contracts is a linear projection from the volume executed to mid-April and that has continued at a pace that will match or exceed that of the H1 expiry.
FIGURE 1
Strategy Volume CGF-CGB
Source: Montréal Exchange
CGF-CGB (5-year/10-year) Steepener
Given the volume in the strategy during the most recent contract, as well as in Z0 contracts, we attempt to get in the mindset of a Portfolio Manager that executed this trade and we examine the process they would have gone through to analyze and execute the trade in futures contracts.
Generally, a good investment process involves the following steps:
- Form a market view
- Decide on a specific security structure for the trade
- Calculate carry/rolldown
- Estimate an ex-ante "reward per unit of risk" (Sharpe)
- Evaluate risks
- Execute
- Monitor & Reevaluate
- Close the trade
To understand some of the thought process a Portfolio Manager may have gone through to establish a futures-based 5-10 curve steepener in late December, we can look at market pricing on December 21st, 2020 and envision his/her analytic process.
Market View
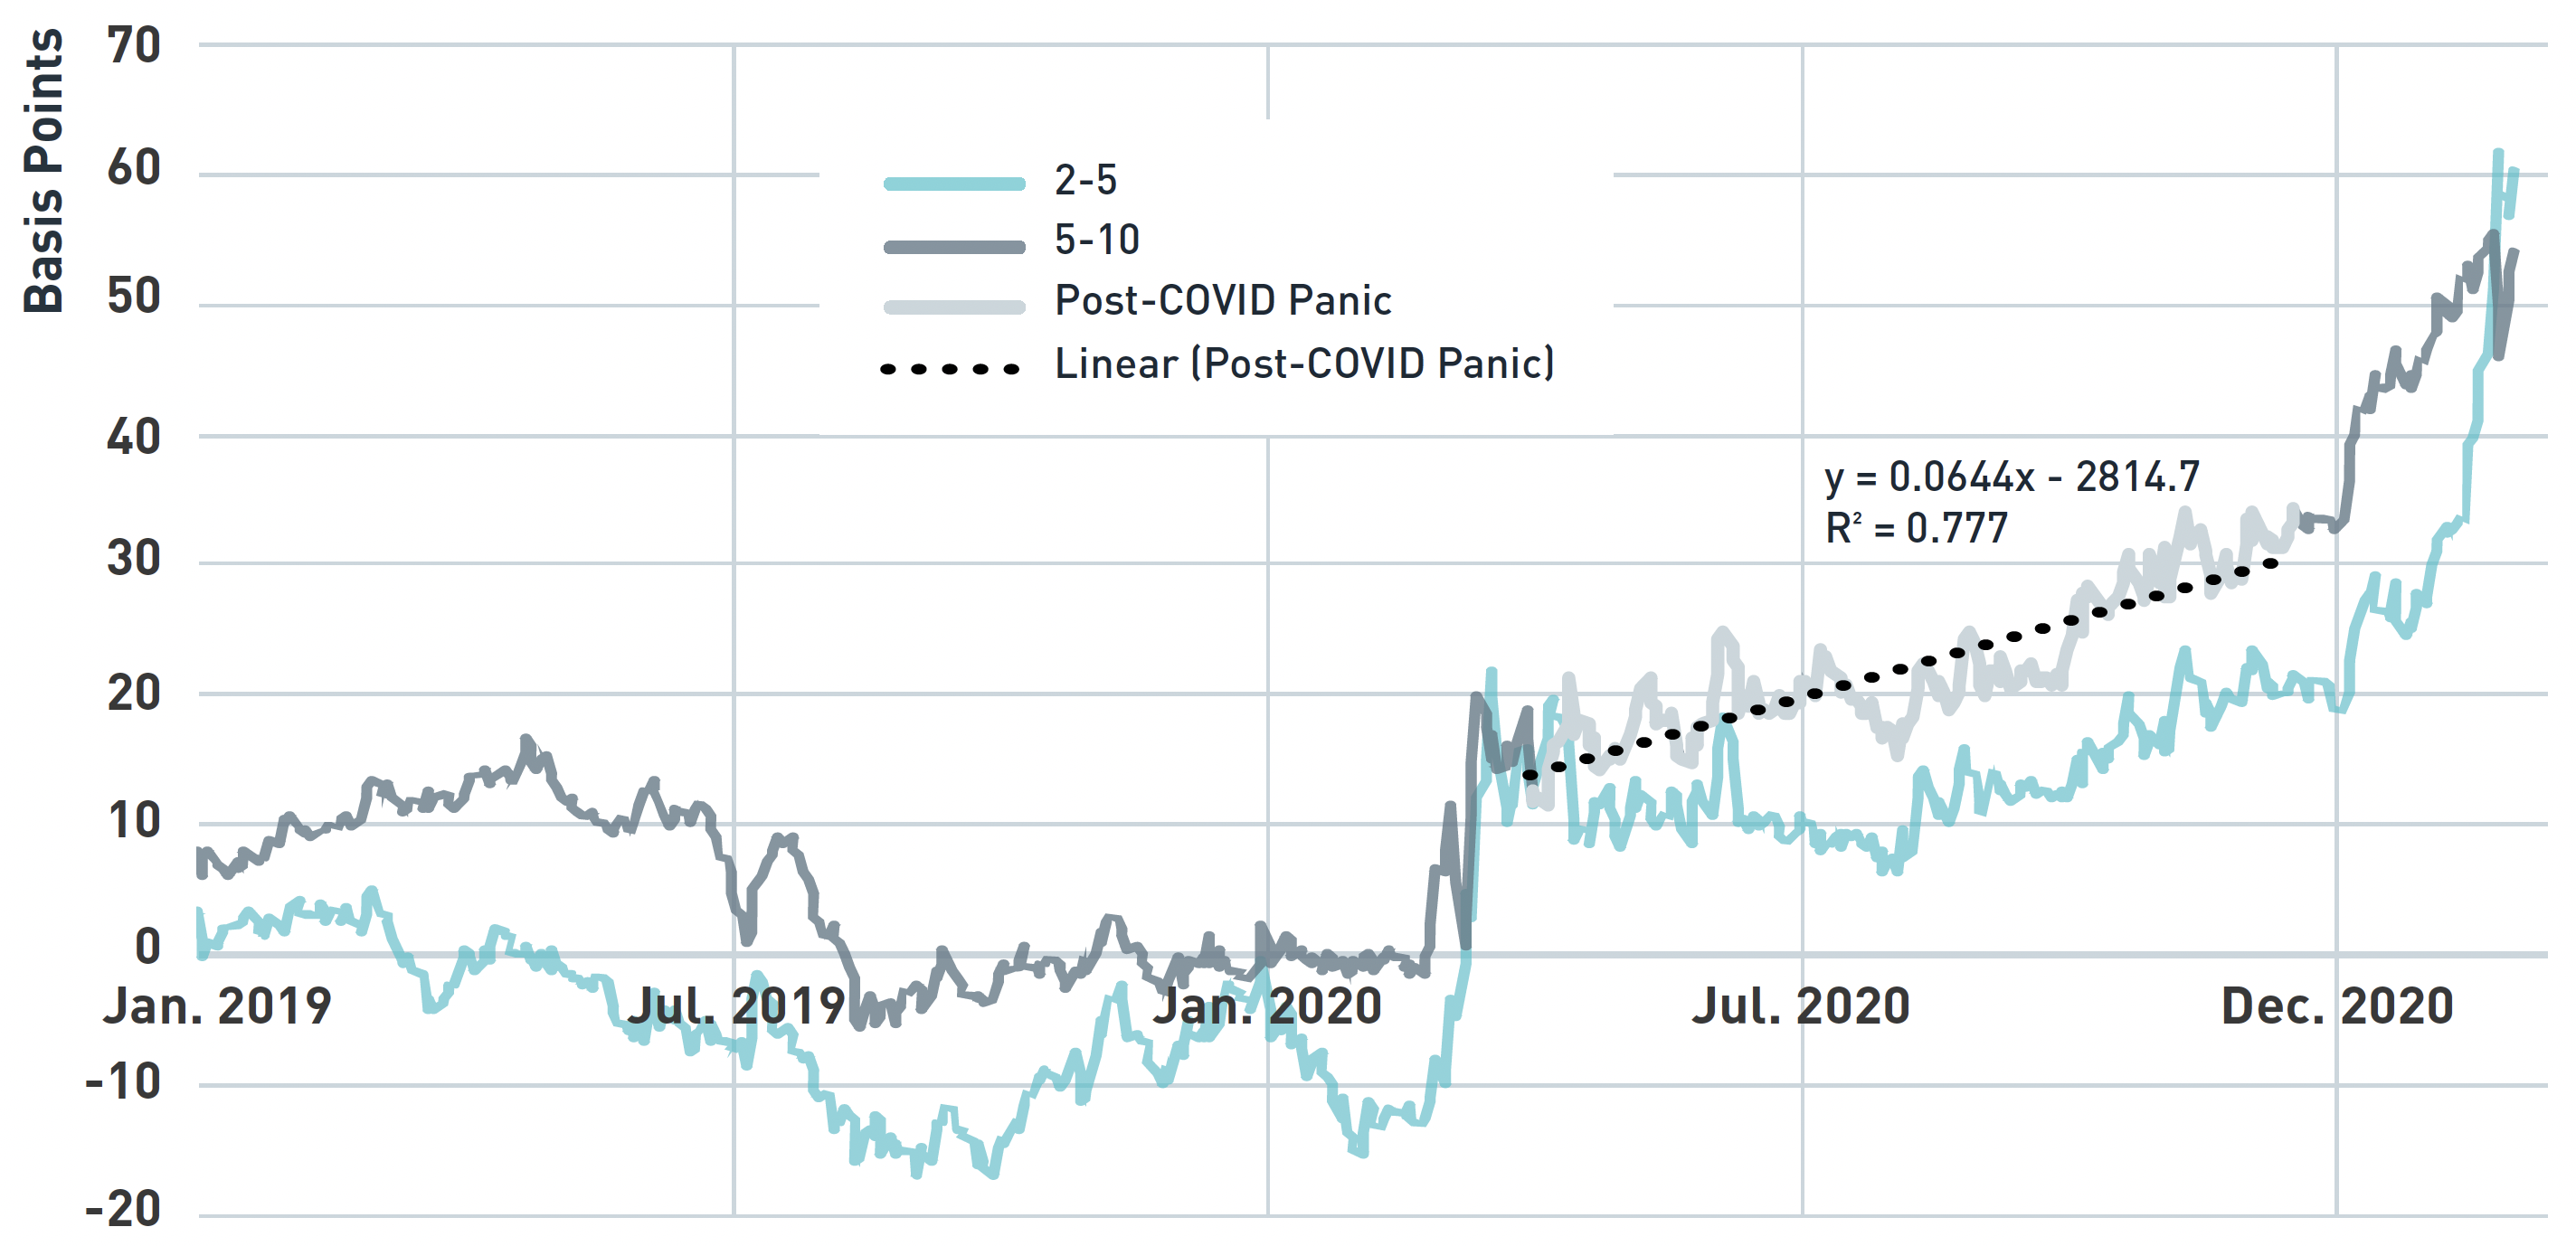
A manager could have formed a steepening view through a macroeconomic analysis that anticipated a faster recovery and/or the onset of rising inflation expectations via monetary stimulus, or even through a simple trend analysis of the 5-10 curve since the end of the pandemic panic in March 2020. We can't necessarily reverse engineer the process of forming a steepening view but we can easily chart the 5-10 curve on December 21st and do a simple linear trend line analysis to see that the curve was steepening about two basis points every month since the end of March 2020. We can also observe that the trend was well established with an r-squared of almost 0.8 (i.e. correlation between the date and the level of yields was almost 90% meaning very little else besides time was required to forecast the slope of the curve). This observation, which may have fed into our fictional Portfolio Manager's decision process, is shown in Figure 2.
FIGURE 2
Canada 2-5 and 5-10 Curve since January 2019
Source: BMO Capital Marketsi Fixed Income Sapphire database
Trade Structure
Futures contracts have become more and more popular to express curve trades since they are accessible without the need for potentially expensive and time-consuming repo financing transactions, have transparent pricing, often avoid balance sheet constraints placed on portfolios, and conserve scarce cash for other uses via the embedded leverage in the contracts. In our example, we will assume that, despite this steepening trade being possible in cash bonds, our Portfolio Manager benefited from the above list of advantages to the contracts and chose to structure the trade in futures.
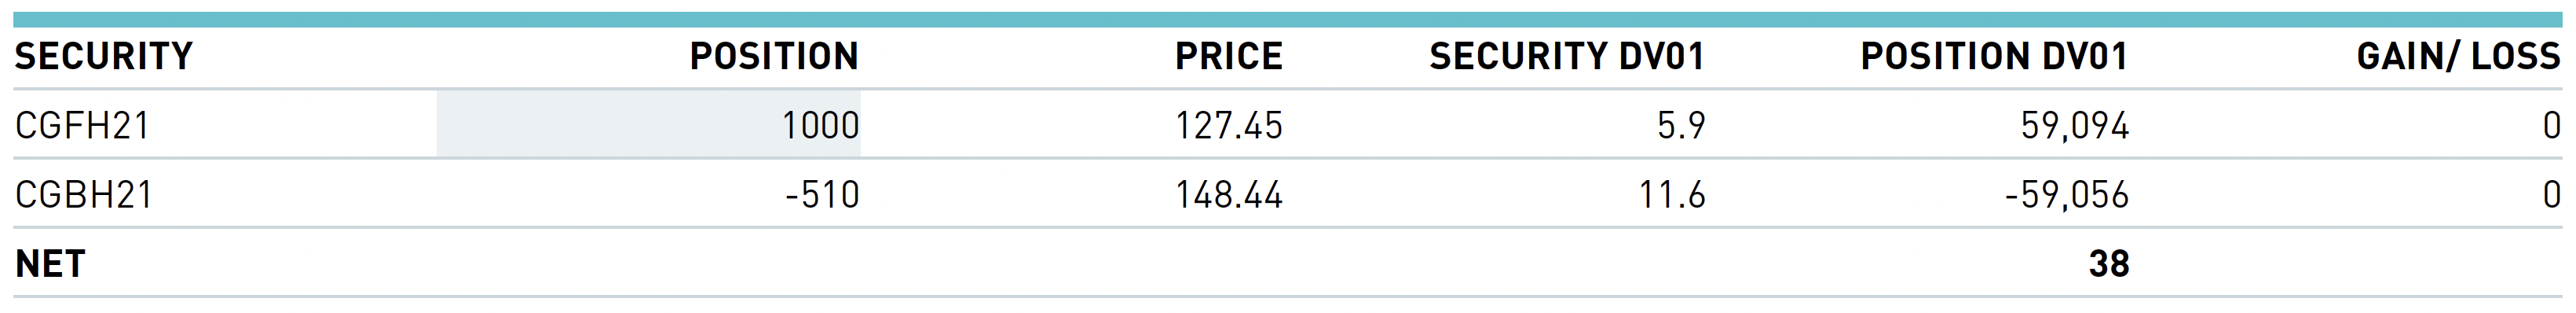
On the trade date, prices for the CGFH21 and CGBH21 contracts were as shown in Figure 3. In terms of execution, the easiest way to attain a DV01-neutral trade would have been to execute the 2CGF-1CGB strategy for 500 units (1000 CGF versus 500 CGB) at a price of 106.462 and then adjust the number of CGB contracts, if desired, to create an exactly DV01 neutral trade. Not all managers choose to do this but, given the low level of interest rates, creating a position that is net long DV01, even by a small amount, probably wouldn't have been palatable.
Figure 3
Source: Montréal Exchange, BMO Capital Marketsi Fixed Income Sapphire database
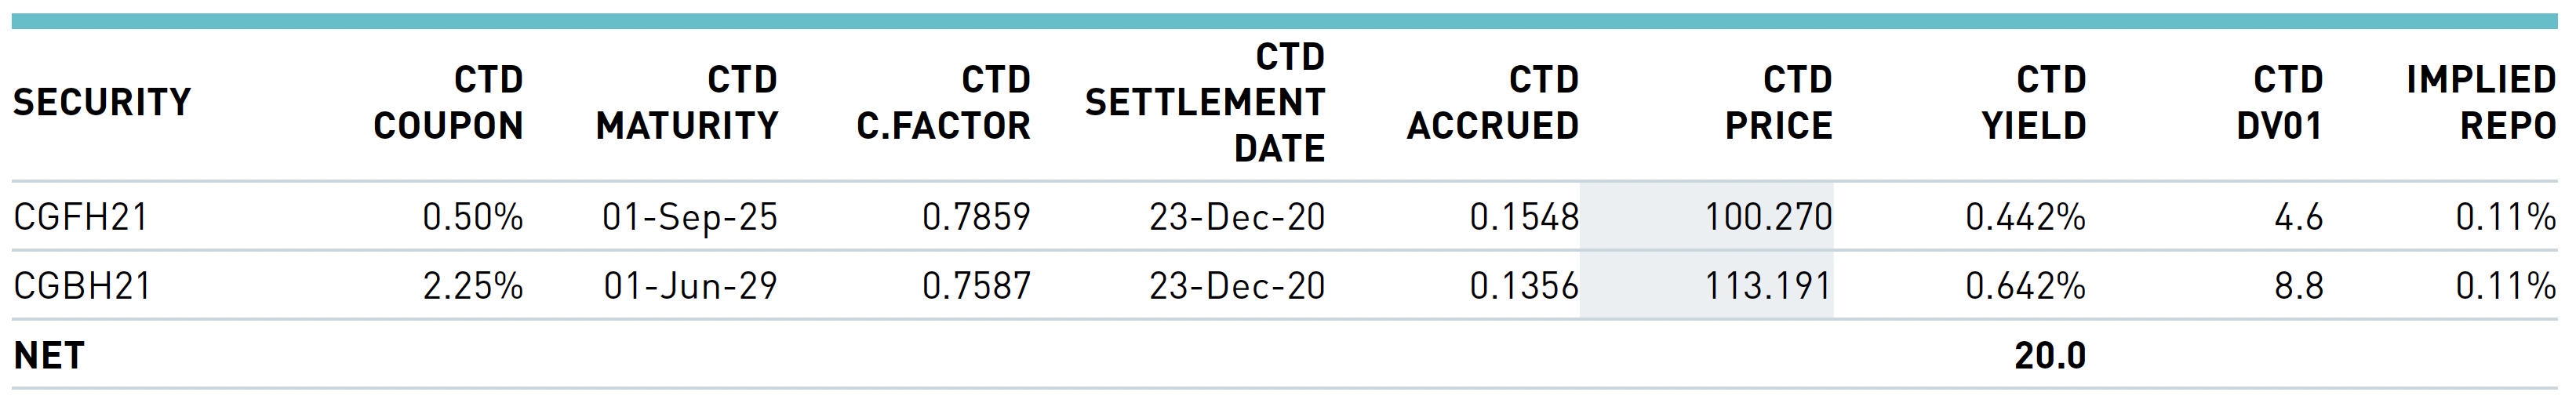
Details of the cheapest-to-deliver bonds that the futures contracts replicate, especially right now when there is no reasonable chance for a cheapest-to-deliver (CTD) switch within the deliverable basket, are shown for reference in Figure 4. The manager would have, synthetically, entered a Sep 2025 (about 4.75 years) – Jun 2029 (about 8.5 years) steepening trade at 20 basis points. The synthetic trade in futures contracts will track very closely the movement in the underlying bonds, of course, but the correlation will not be perfect as the relative value of the CTD versus the futures contract will fluctuate and be observed in the level of futures basis (not shown) and the implied repo3 for the CTD bond.
Figure 4
Source: BMO Capital Marketsi Fixed Income Sapphire database, Montréal Exchange
Carry/Rolldown
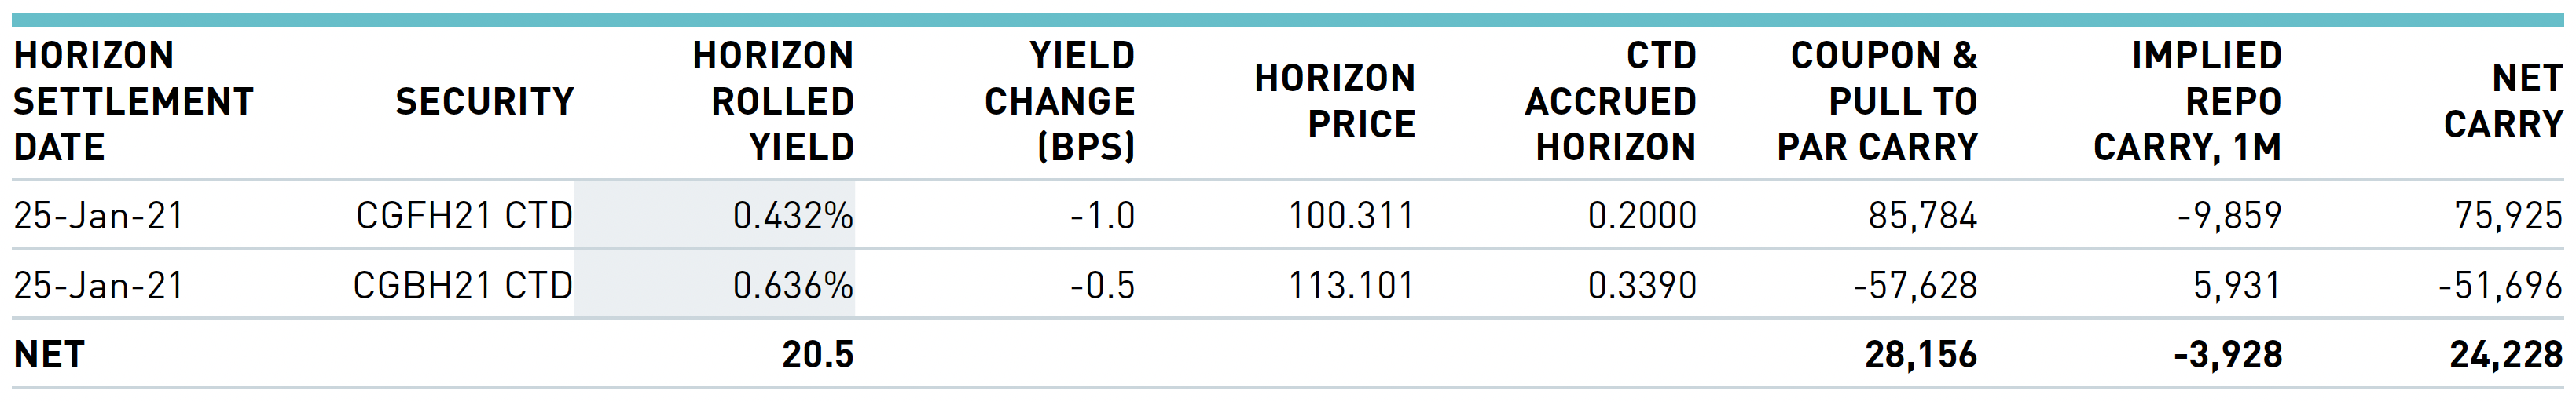
An important consideration before entering any trade is the cost of holding the trade over the horizon period. We can evaluate this metric by re-pricing the bonds one month into the future with the assumption that the yield curve does not change over this time horizon. After doing so, we can price the cost of financing using the implied repo for the contracts, and sum the two results. These calculations are shown in Figure 5; the manager would have found that the steepening trade had positive net carry of about 0.4 basis points per month, or $25,000 per month for the trade shown in Figure 3.
Figure 5
Source: BMO Capital Marketsi Fixed Income Sapphire database
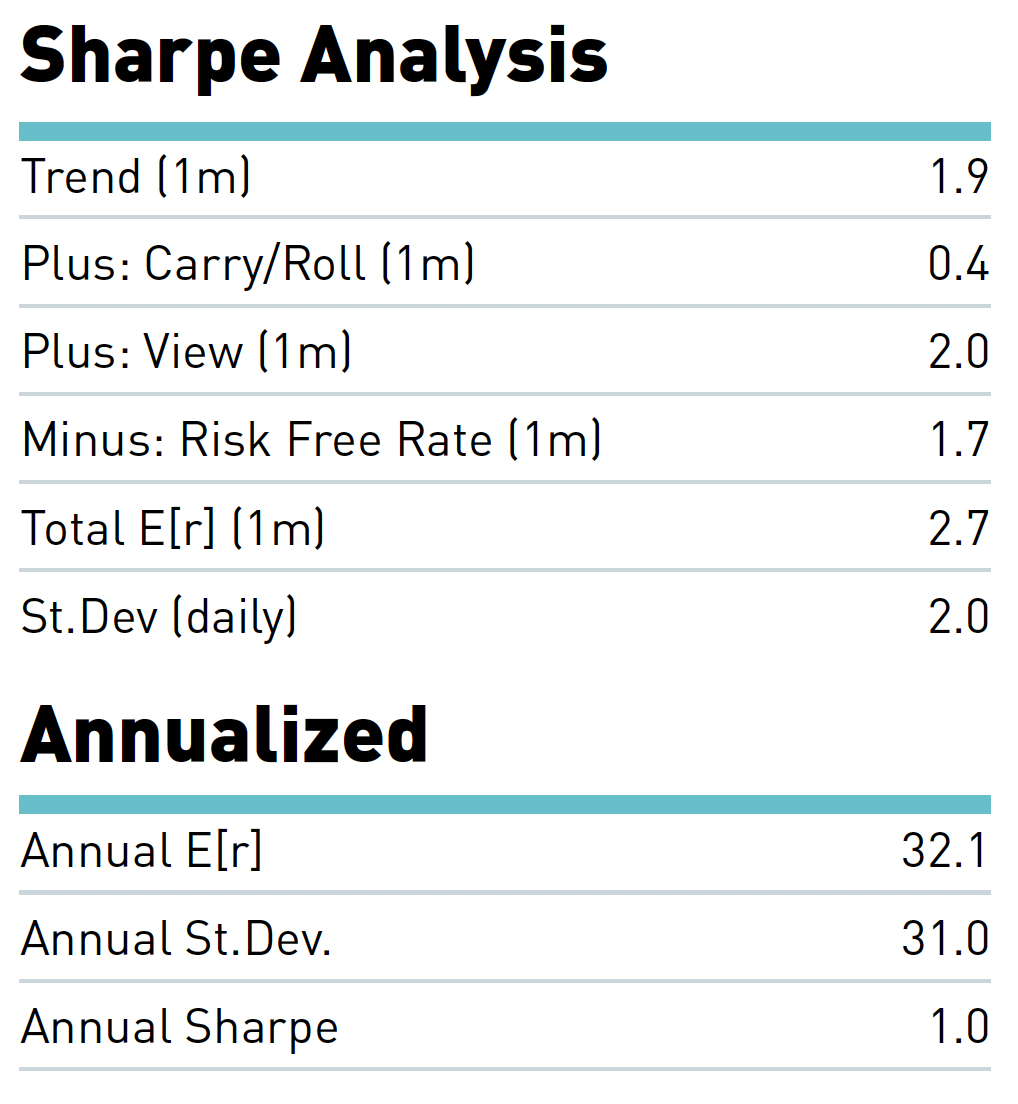
Ex-Ante Sharpe Analysis
Although not all managers perform a forward-looking analysis for each trade, it is often useful to decide between several different potential trades, or to decide in what manner a view is best expressed. In this case, we calculate the expected return at a 1-month horizon date by calculating the trend (from Figure 2), the expected carry and rolldown (Figure 5) and a hypothetical view of the manager that an additional 2 basis points of steepening will manifest during the evaluation period. The total expected return of 4.3 basis points in one month less the risk-free rate is annualized and then divided by the daily standard deviation, also annualized4, to generate an ex-ante Sharpe ratio of about 1.0 on December 21st. These amounts are summarized in Figure 6.
Figure 6
Evaluate Risks
The predominant risk in any curve steepener is that the expected macro view is incorrect. In this case that can take two forms. First, the curve can flatten due to 5-year yield levels rising where markets price an earlier increase in the target rate by the Bank of Canada due to accelerating economic conditions. Second, the curve can flatten due to 10-year yields falling rapidly as markets price low overnight rates for even longer, or the absence of inflation in the longer term.
Given the expected slow recovery from the pandemic and potential bad news, the second risk is probably greater over time as even a sustained recovery from a recession rarely proceeds in a uniform and consistent fashion. A key takeaway here is that rapid flattening is entirely possible via the second scenario but probably not the first since upside economic surprises tend to be less common and intense than downside surprises.
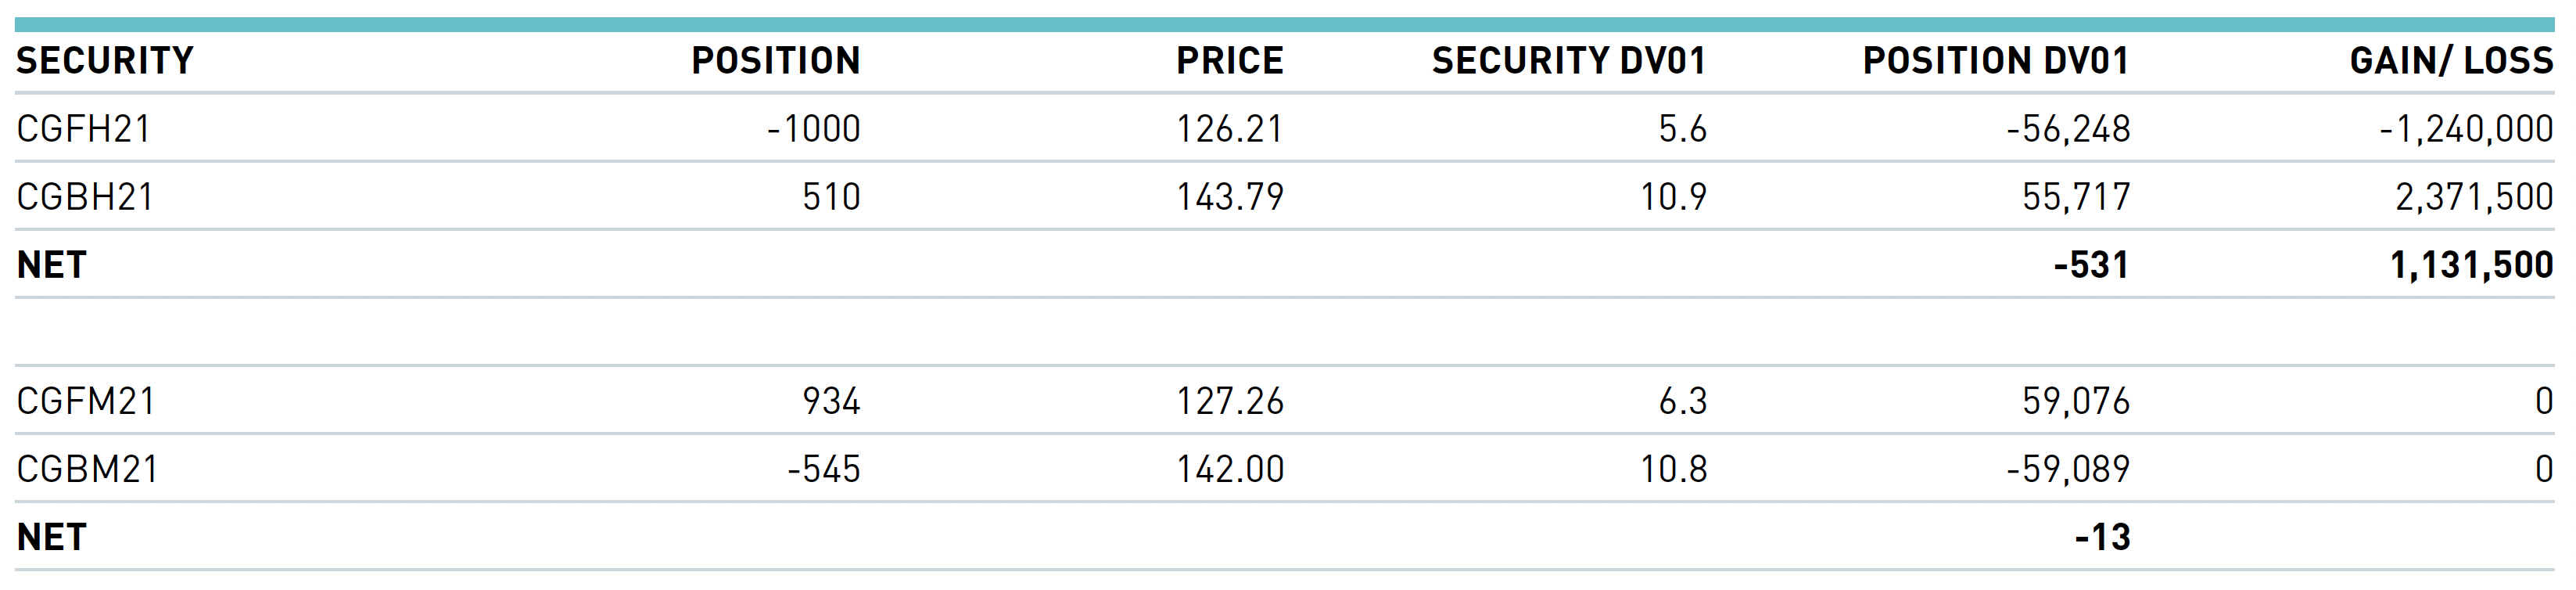
Monitor and Re-evaluate
One complication, despite the many advantages, of realizing this trade in futures is the need to roll the position to the new active contract at the end of February if the manager wished to keep the exposure. This transaction would have occurred during the liquid period of the futures roll from H21 to M21 contracts, say February 23rd. By this time, the curve had steepened substantially and any manager holding this position would have significant profits but may have decided to let the trade run further.
The roll transaction is illustrated in Figure 7. The manager closes the positions entered on December 21st and enters new positions in CGFM21 and CGBM21. Note that the contract totals are slightly different as the DV01 of CGFM21 was significantly higher than that of CGFH21. We have chosen to keep the original DV01 amount of the trade, but the manager could obviously have decided to adjust it to any level he or she desired on the roll date5. The final column in Figure 7 shows the realized profit to February 23rd, at which point the curve had already steepened just under 20 basis points to 39.8.
Figure 7
Source: Montréal Exchange
Close the Trade
Finally, on March 3rd, after a flattening scare that cost the strategy a few basis points which were quickly recaptured, our fictional manager decides to close the trade and lock in profits. These transactions are depicted in Figure 8 where the manager gains another couple of basis points and books a profit of almost $132,000 since the roll date for a total of $1.263 million or 21.4 basis points.
Figure 8

Source: Montréal Exchange
Summary
In summary, we suspect a lot of managers went through a thought process like that described above and generated significant profits for their portfolios in early 2021. By deciding to execute the trade in futures contracts, these managers benefited from straightforward simultaneous execution in the Inter-Group Strategy listed trade, avoided the need to conduct frequent and potentially expensive repo financing transactions, and may have conserved their scarce balance sheet and/or benefited from the embedded leverage in the contracts.
For more information, sign up to receive the latest news and updates or contact us.
1 Officially referred to as an Inter-Group Strategy, data is published daily at https://www.m-x.ca/nego_igs_en.php. Each data point refers to 2 CGF contracts versus 1 CGB contract.
2 The 2CGF-1CGB strategy price = 2 x CGF price - 1 x CGB price = 2 x 127.45 - 1 x 148.44 = 106.46
3 For more information on the implied repo rate, refer to article "Understanding the Implied Repo Rate" published in April 2020.
4 By multiplying by the square root of 250 trading days per year.
5 Or at any other time.
About the author:

Kevin Dribnenki
Kevin Dribnenki writes about fixed income derivatives and opportunities in Canadian markets. He spent over 10 years managing fixed income relative value portfolios as a Portfolio Manager first at Ontario Teachers' Pension Plan and then BlueCrest Capital Management. During that time he managed domestic cash bond portfolios as well as international leveraged alpha portfolios and has presented at several fixed income and derivatives conferences. He received a BA in Economics from the University of Victoria, an MBA from the Richard Ivey School of Business, and holds the Chartered Financial Analyst designation.Follow Kevin on LinkedIn
i BMO Capital Markets is a trade name used by BMO Financial Group for the wholesale banking business of Bank of Montreal, BMO Harris Bank N.A. (member FDIC), Bank of Montreal Ireland plc., and Bank of Montreal (China) Co. Ltd and the institutional broker dealer businesses of BMO Capital Markets Corp. (Member SIPC) in the U.S., BMO Nesbitt Burns Inc. (Member Canadian Investor Protection Fund) in Canada and Asia and BMO Capital Markets Limited (authorized and regulated by the Financial Conduct Authority) in Europe and Australia. "BMO Capital Markets" is a trademark of Bank of Montreal, used under license.
The views, opinions and advice provided in this publication reflect those of the individual author.
Copyright © 2021 Bourse de Montréal Inc. All rights reserved. Do not copy, distribute, sell or modify this document without Bourse de Montréal Inc.'s prior written consent.This information is provided for information purposes only. This publication is not endorsed by TMX Group or any of its affiliated companies. Neither TMX Group Limited nor any of its affiliated companies guarantees the completeness of the information contained in this publication, and we are not responsible for any errors or omissions in or your use of, or reliance on, the information. This publication is not intended to provide legal, accounting, tax, investment, financial or other advice and should not be relied upon for such advice. The information provided is not an invitation to purchase securities or derivatives listed on Montreal Exchange, Toronto Stock Exchange and/or TSX Venture Exchange. TMX Group and its affiliated companies do not endorse or recommend any securities referenced in this publication. CGB, CGF, CGZ, Montréal Exchange and MX are the trademarks of Bourse de Montréal Inc. TMX, the TMX design, The Future is Yours to See., and Voir le futur. Réaliser l'avenir. are the trademarks of TSX Inc. and are used under license.